A tool to create Voronoi diagram for polygons.

Project description
Voronoi diagram for polygons


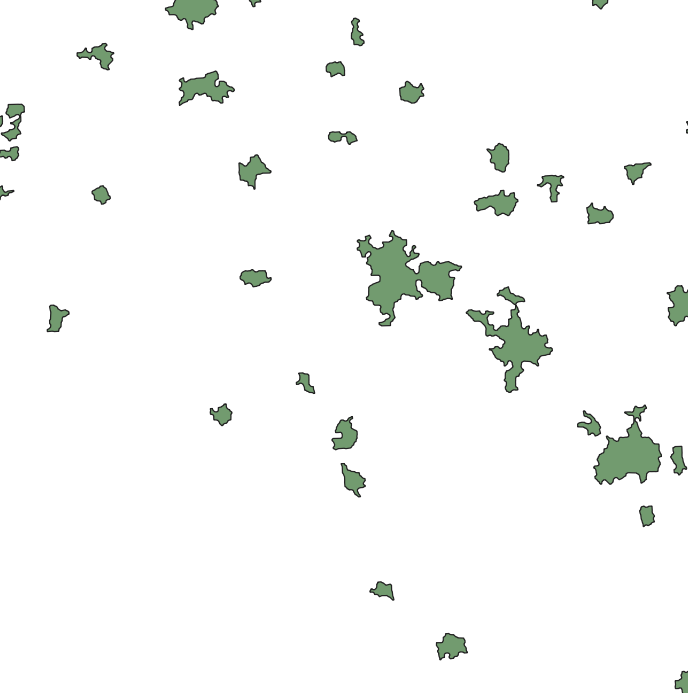
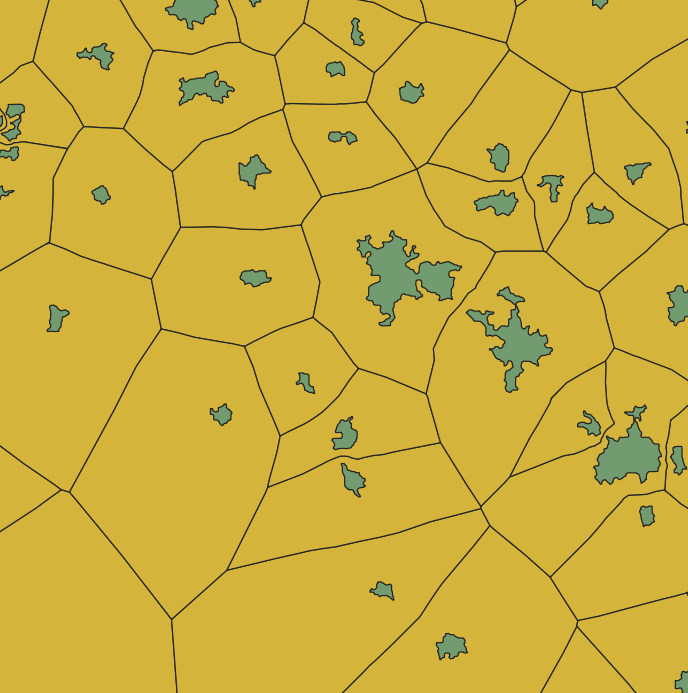
Voronoi diagram for polygons is a tool to create a Voronoi diagram also known as Thiessen polygons for polygons. It's based on Shapely and GeoPandas. There are lots of tools to create a Voronoi diagram for points, for example Create Thiessen Polygons (Analysis) in ArcGIS Pro or ArcGIS Desktop, Voronoi Polygons in QGIS, or voronoi_diagram in Shapely. All of them are really cool. How about a Voronoi diagram for polygons? That's what this tool does.
Important! You have to install or upgrade to the latest developing version of Shapely before install Voronoi diagram for polygons
Table of contents
Installation, update and uninstallation
Dependencies
Important! It's based on voronoi_diagram from Shapely which is new in version 1.8.dev0. As of today, it is still a developing version. (2020-07-26) You have to install or upgrade to the latest developing version from source firstly:
pip install git+https://github.com/Toblerity/Shapely
pip install --upgrade git+https://github.com/Toblerity/Shapely
To install
Quick installation with pip:
pip install voronoi-diagram-for-polygons
Or from github:
pip install git+https://github.com/longavailable/voronoi-diagram-for-polygons
Also, you can just copy related functions from longsgis/longsgis.py to your work.
To update
pip install --upgrade voronoi-diagram-for-polygons
To uninstall
pip uninstall voronoi-diagram-for-polygons
Usage
See tests/01voronoiDiagram4plg.py.
import geopandas as gpd
from longsgis import voronoiDiagram4plg

builtup = gpd.read_file('input.geojson'); builtup.crs = 32650
boundary = gpd.read_file('boundary.geojson'); boundary.crs = 32650
vd = voronoiDiagram4plg(builtup, boundary)
vd.to_file('output.geojson', driver='GeoJSON')
FAQ
-
I/O support.
It was noticed someone were struggled with the input/output files with a format of
.geojson(https://github.com/longavailable/voronoi-diagram-for-polygons/issues/3, https://github.com/longavailable/voronoi-diagram-for-polygons/issues/5). Actually, that's not a question related to this package. I will explain more here about it. This package is totally based on GeoPandas. In other words, any format that can be converted togeopandas.GeoDataFrameobject is supported. As the official documentation said:geopandas can read almost any vector-based spatial data format including ESRI shapefile, GeoJSON files and more using the command:
geopandas.read_file()That means, you can put your
.shpfiles as inputs and output as well. Any format you'd like. I used a few geojson-s (input.geojson,boundary.geojson, andoutput.geojson) in my example because the geojson format is very open. However, it's NOT necessary.For more, I upload the input.geojson and boundary.geojson files. Hope they helps. For the sake of caution, I declare here that they are only a test file, any actual geographical data, similar or not, I have no guarantee to the accuracy and authenticity for them.
Known shortages
-
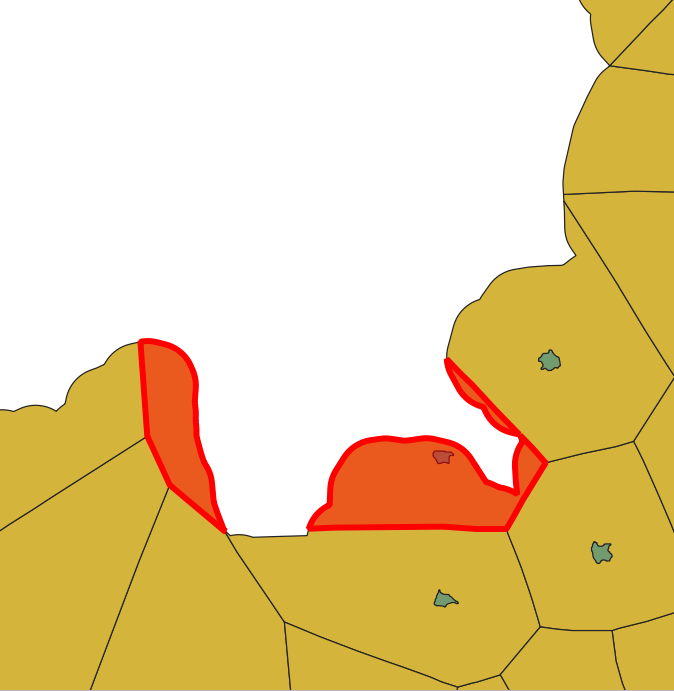
It may produce multipolygons (consisted by some unconnected polygons) around the boundary.
-
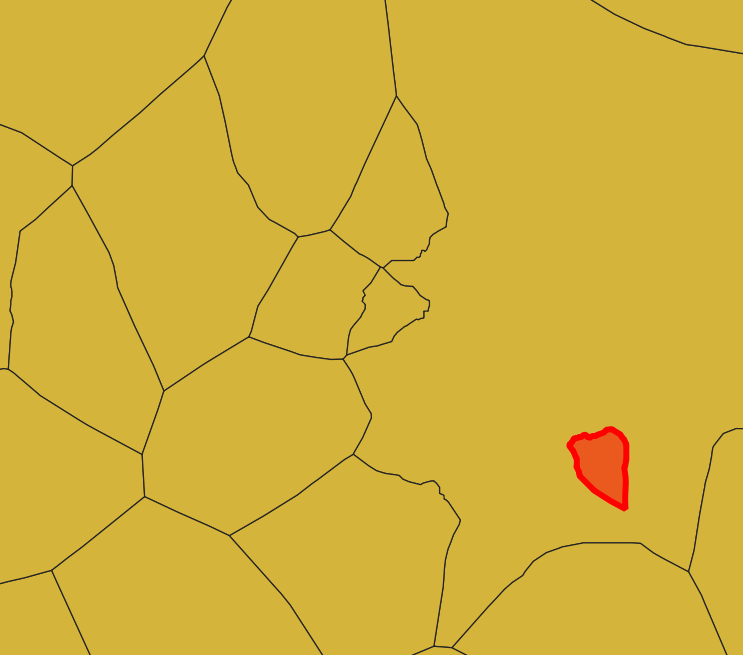
Special input may cause overlap. See the following:
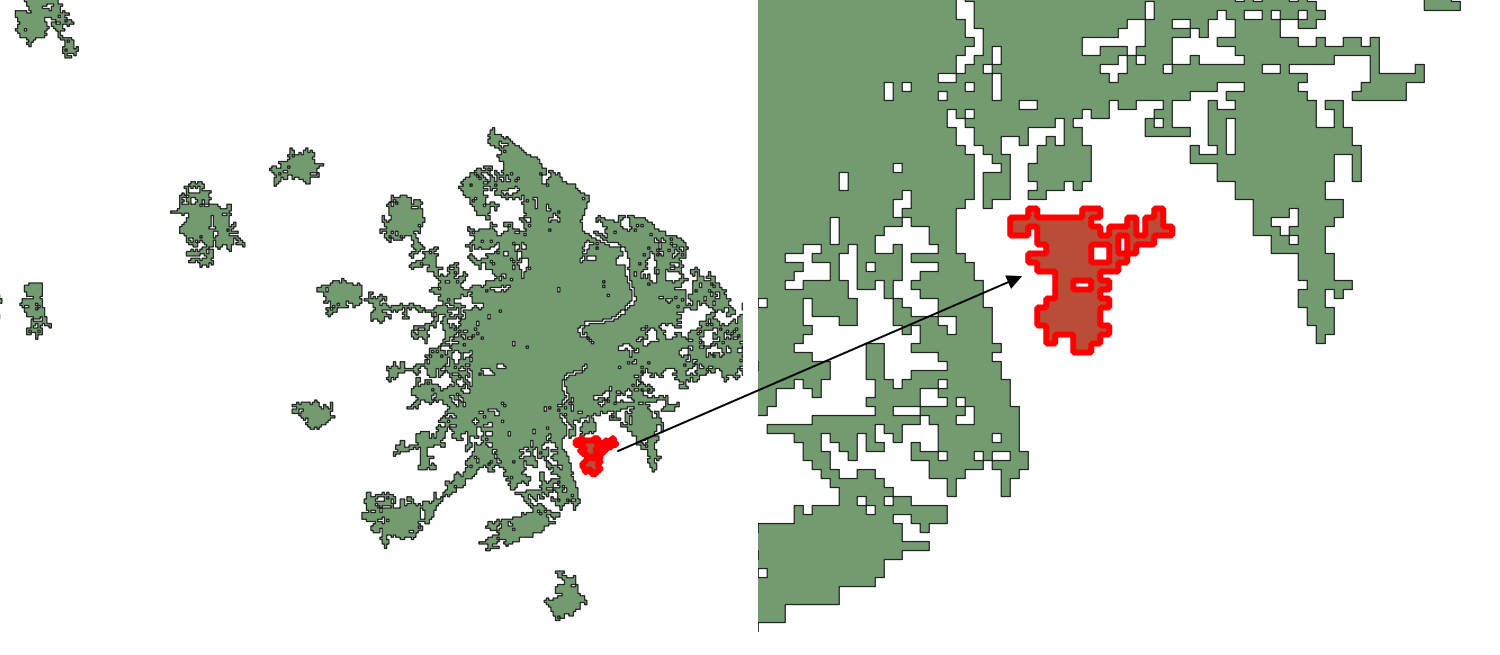
To avoid this, I recommend reasonable preprocessing of the input, but use a buffer operation with high-resolution carefully. A buffer operation with high-resolution will result in circular arcs, which will generate too many vertices in a local area. This may trigger other bugs. In my practices, the following code snippet worked well.
def bufferDissolve(gdf, distance, join_style=3):
	'''Create buffer and dissolve thoese intersects.

	Parameters:
		gdf:
			Type: geopandas.GeoDataFrame
		distance: radius of the buffer
			Type: float
	Returns:
		gdf_bf: buffered and dissolved GeoDataFrame
			Type: geopandas.GeoDataFrame
	'''
	#create buffer and dissolve by invoking `unary_union`
	smp = gdf.buffer(distance, join_style).unary_union
	#convert to GeoSeries and explode to single polygons
	gs = gpd.GeoSeries([smp]).explode()
	#convert to GeoDataFrame
	gdf_bf = gpd.GeoDataFrame(geometry=gs, crs=gdf.crs).reset_index(drop=True)
	return gdf_bf
How to cite
If this tool is useful to your research, star and cite it as below:
Xiaolong Liu, & Meixiu Yu. (2020, July 26). longavailable/voronoi-diagram-for-polygons. Zenodo.
http://doi.org/10.5281/zenodo.3960407
Easily, you can import it to Mendeley.
Changelog
v0.1.1
- First release.
v0.1.2
- Fix a FutureWarning.
v0.1.3
- Make it more robust for the less-vertice-geometry inputs. #4.
- Fix a few FutureWarnings.
v0.1.6 (Merged)


Download files
Download the file for your platform. If you're not sure which to choose, learn more about installing packages.
Source Distribution
Built Distribution
Hashes for voronoi-diagram-for-polygons-0.1.6.tar.gz
| Algorithm | Hash digest | |
|---|---|---|
| SHA256 | c4e32694bcbeffa84ff6b14f55af229736bcb177470b42f03f7be1b62b867cdb |
|
| MD5 | bdca4065c39a42a0a9c251448a47e436 |
|
| BLAKE2b-256 | 188ae4b1ea7936e4ed44ef0e6183ed47555cf7a0d05cd1f09b456d492b4819a6 |
Hashes for voronoi_diagram_for_polygons-0.1.6-py3-none-any.whl
| Algorithm | Hash digest | |
|---|---|---|
| SHA256 | f00b63b0fd78beb0eecefba51ce96909b99687dfa2ec62500774c3b629acb87e |
|
| MD5 | fac56d5680c628e1434c9a190afced45 |
|
| BLAKE2b-256 | 964b7109c1ebeddfef0b28ed8d69ca408a10786aae6a65676333603fb61f0a14 |


