pandasecharts 0.5
pip install pandasecharts
Latest version
Released:
Visualize your pandas data with one-line code
Navigation

Unverified details
These details have not been verified by PyPIProject links
Meta
- License: MIT License
- Author: gamersover
- Tags pandas, echarts, data visualization
- Requires: Python >=3.6, <4
Classifiers
- Development Status
- Intended Audience
- License
- Programming Language
- Topic
Project description
PandasEcharts


简介
基于pandas和pyecharts的可视化工具,该项目的旨在用一行代码可视化您的pandas数据。
安装
pip 安装
$ pip install pandasecharts
源码安装
$ git clone https://github.com/gamersover/pandasecharts
$ cd pandasecharts
$ pip install -r requirements.txt
$ python setup.py install
使用
notebook环境
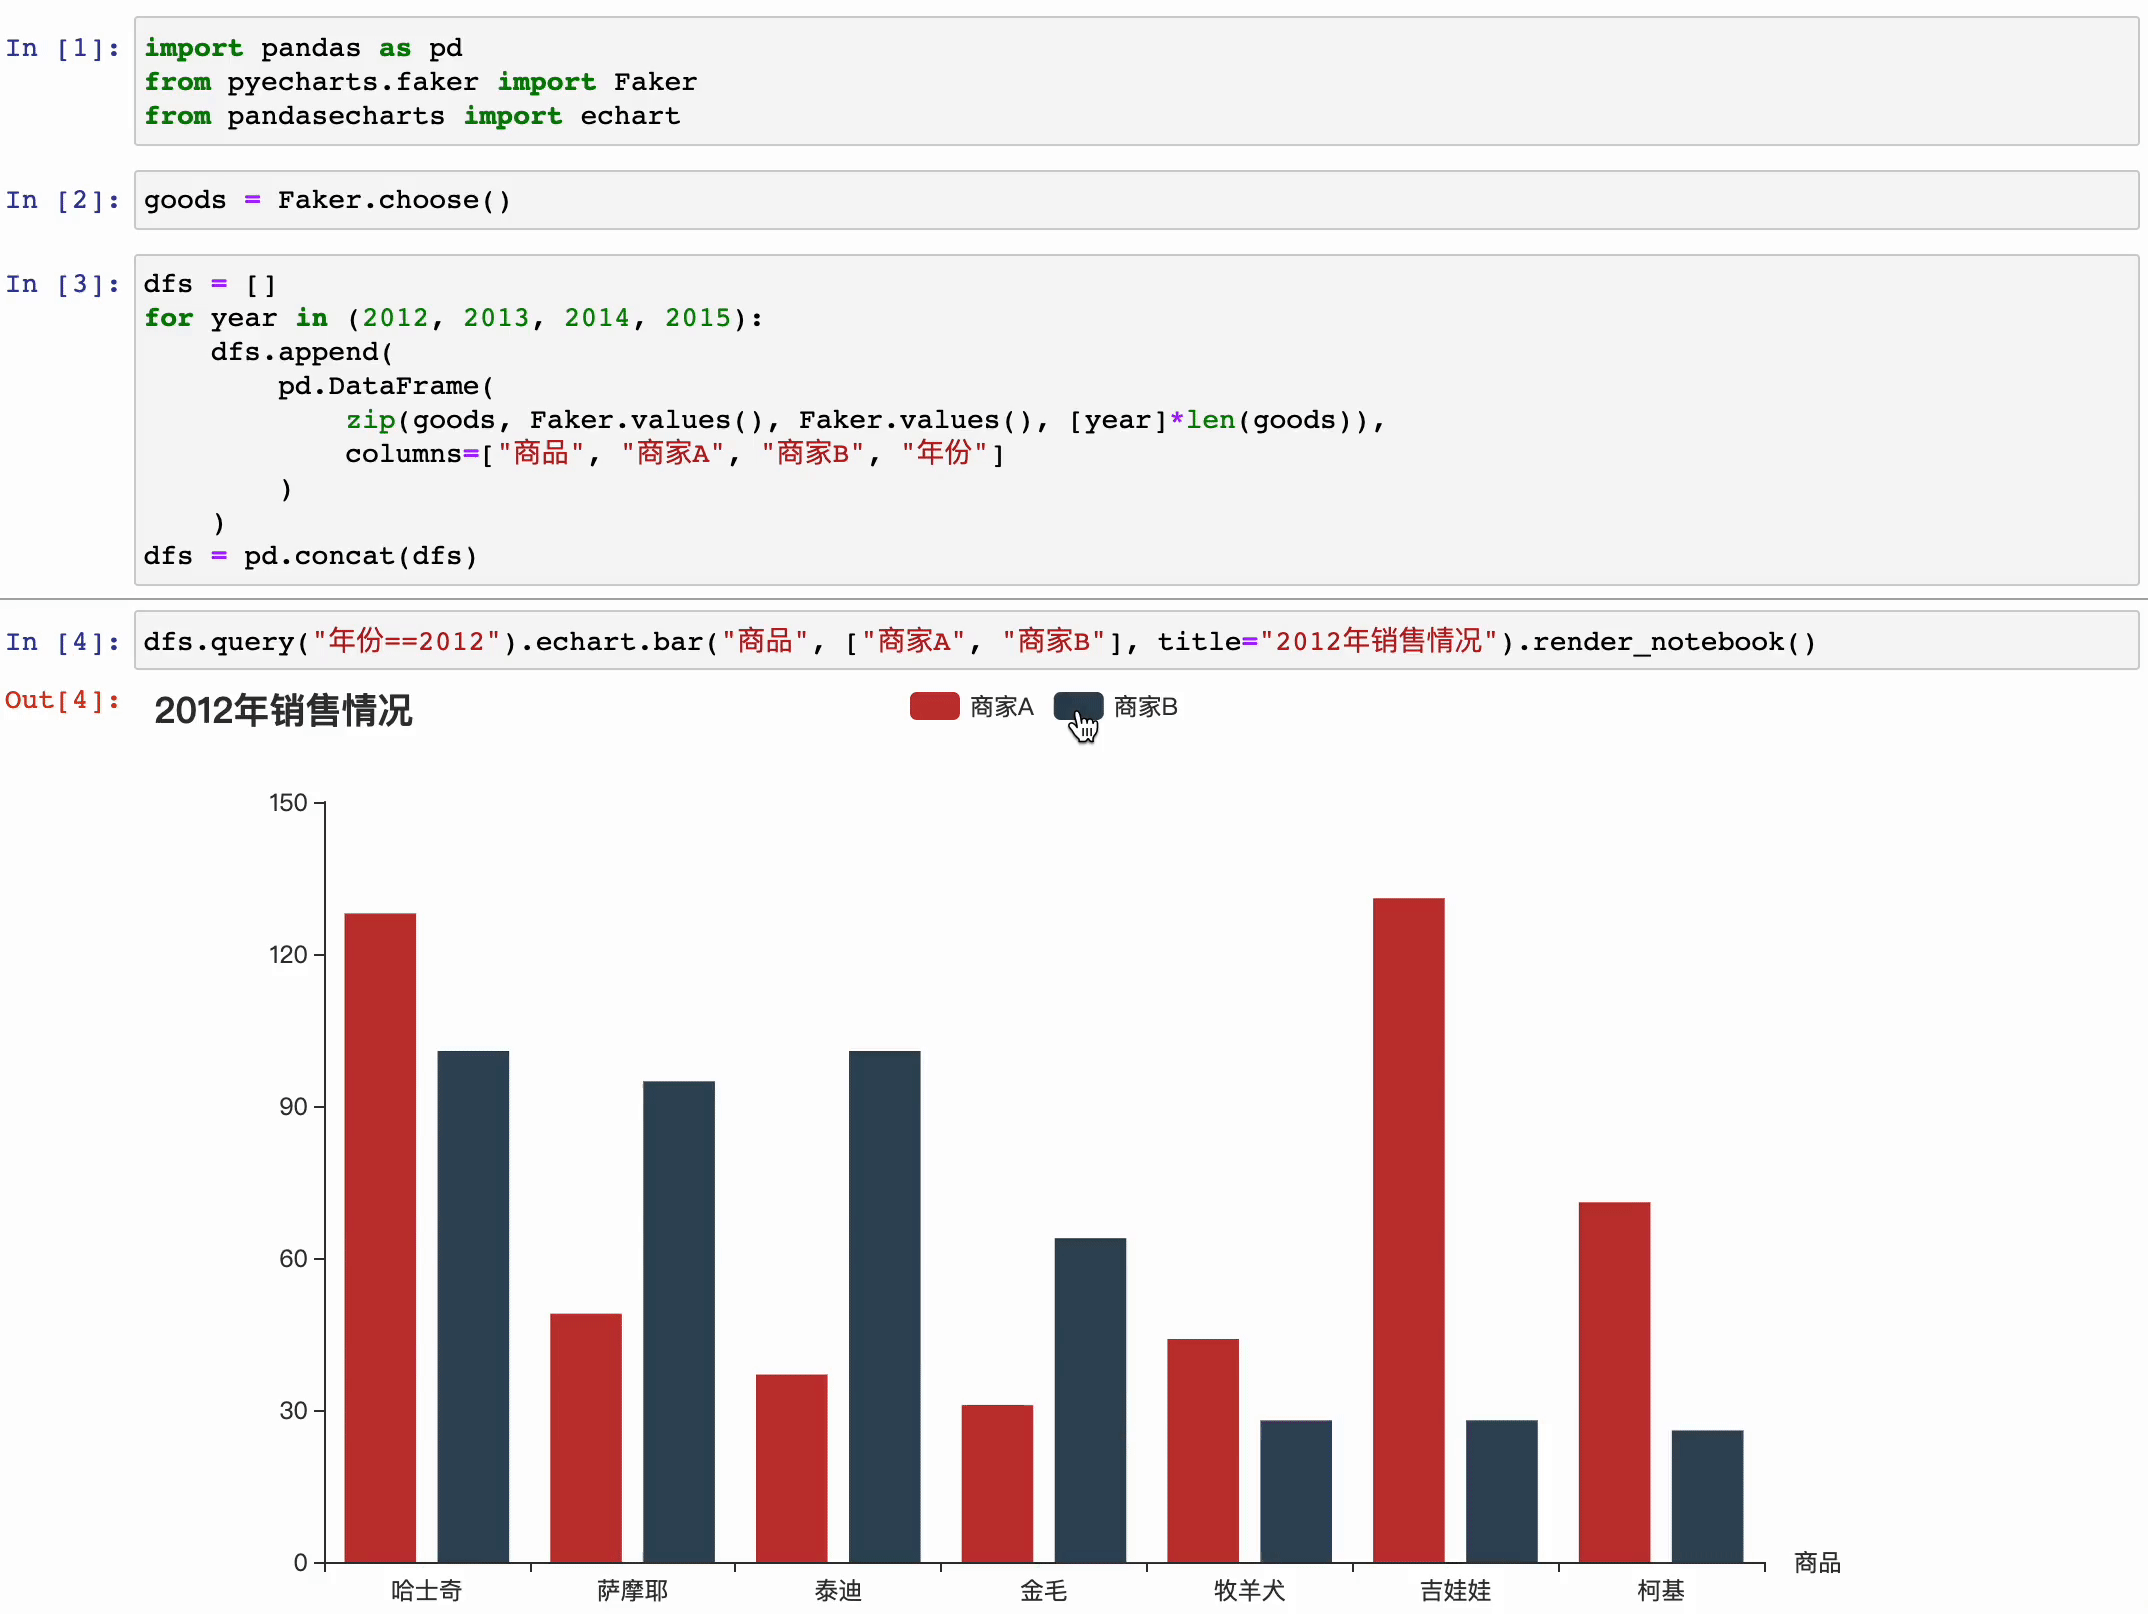
- 基本直方图
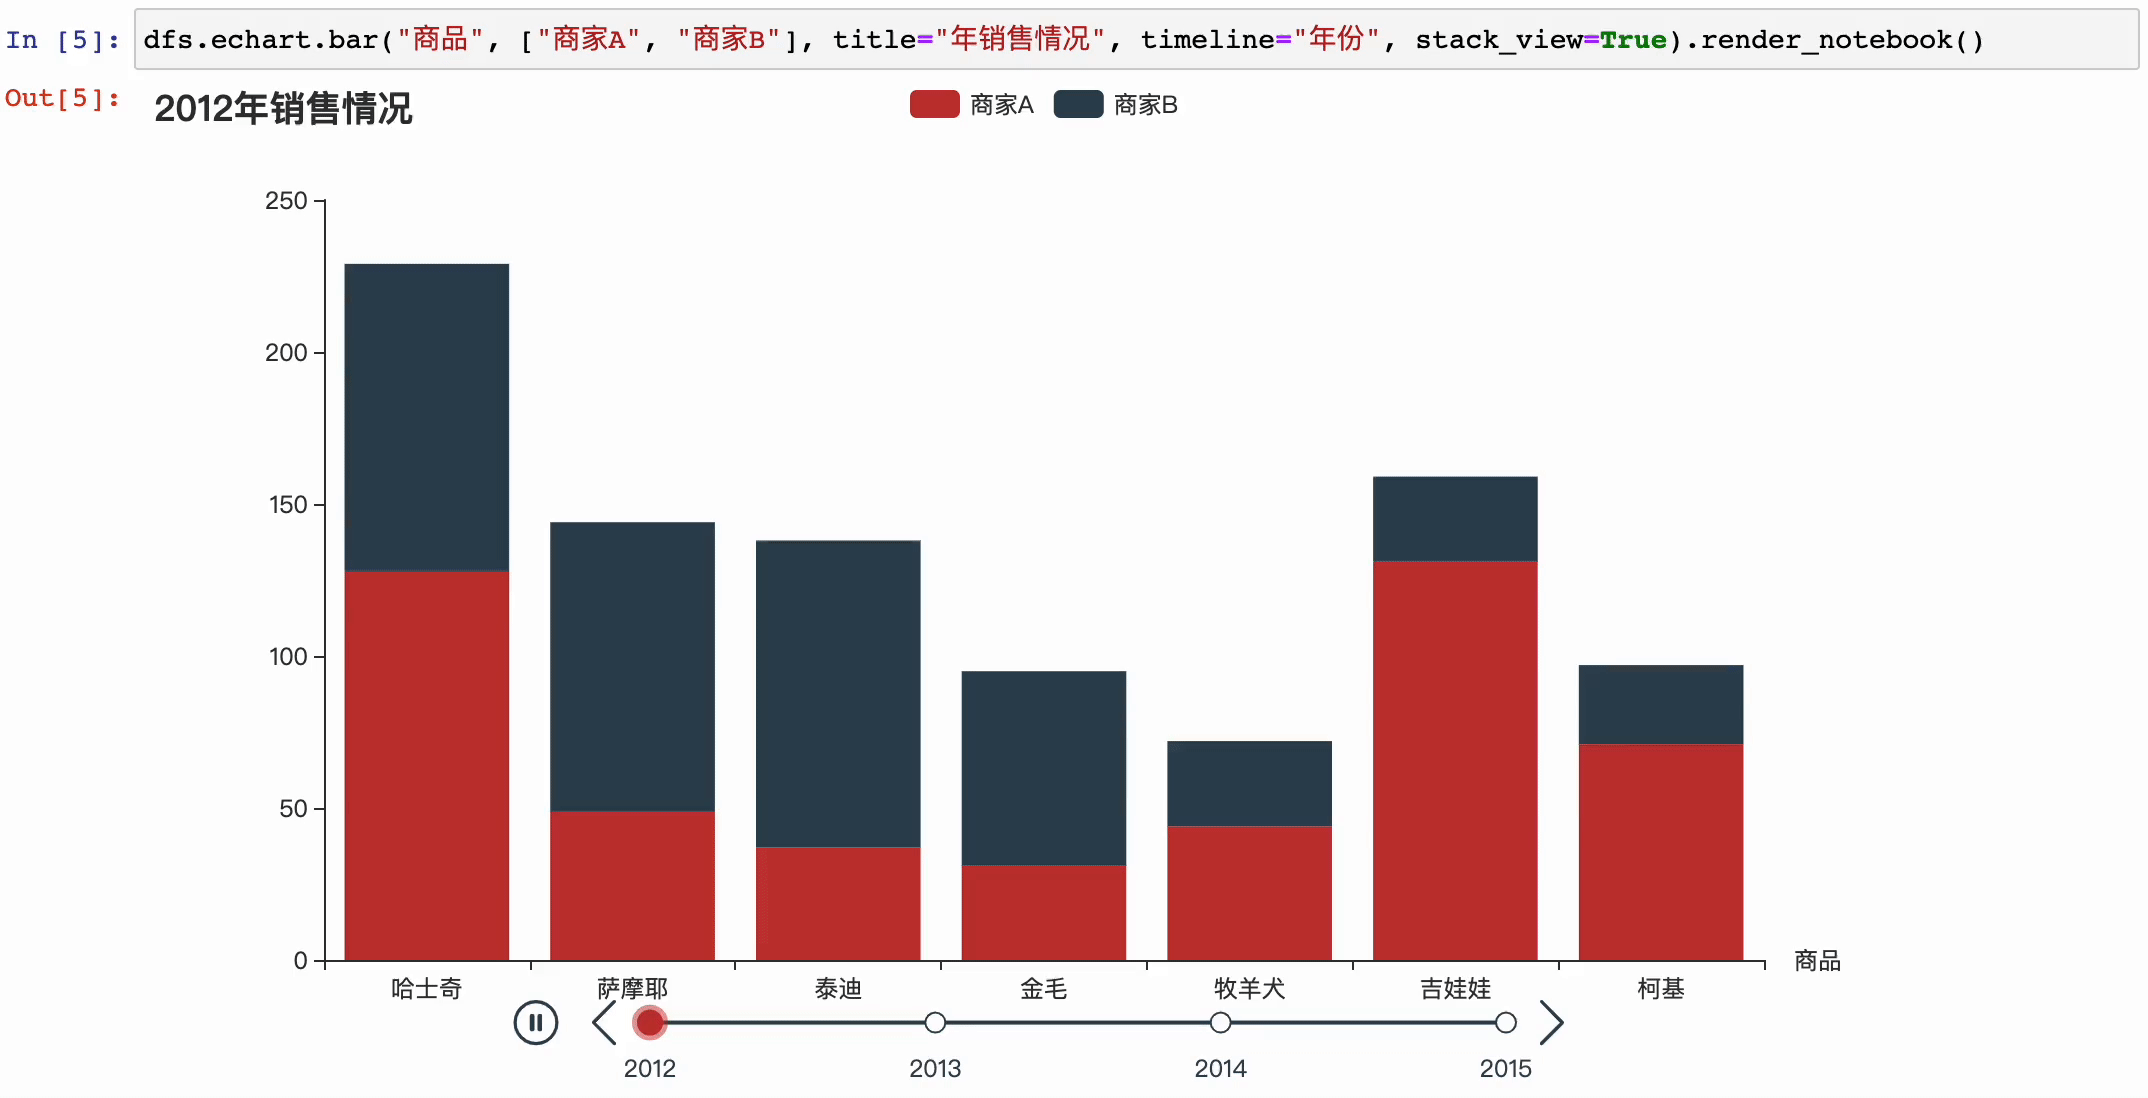
- 带时间变化的直方图
更多使用方法请访问
后续计划
目前已支持图表类型
- Pie
- Bar
- Bar3D
- Line
- Line3D
- Scatter
- Scatter3D
- Boxplot
- Geo
- Map
- Funnel
- Calendar
- WordCloud
0.5版本计划
- 支持代码提示
- 加入datazoom
- 修复line图形当xtype为value时需要排序的问题
License
MIT ©gamersover
Project details
Unverified details
These details have not been verified by PyPIProject links
Meta
- License: MIT License
- Author: gamersover
- Tags pandas, echarts, data visualization
- Requires: Python >=3.6, <4
Classifiers
- Development Status
- Intended Audience
- License
- Programming Language
- Topic
Release history Release notifications | RSS feed


Download files
Download the file for your platform. If you're not sure which to choose, learn more about installing packages.
Source Distribution
Built Distribution
File details
Details for the file pandasecharts-0.5.tar.gz.
File metadata
- Download URL: pandasecharts-0.5.tar.gz
- Upload date:
- Size: 18.0 kB
- Tags: Source
- Uploaded using Trusted Publishing? No
- Uploaded via: twine/3.6.0 importlib_metadata/4.8.2 pkginfo/1.8.1 requests/2.26.0 requests-toolbelt/0.9.1 tqdm/4.62.3 CPython/3.8.9
File hashes
| Algorithm | Hash digest | |
|---|---|---|
| SHA256 | 93183eb9bf550edb14c84bb1eb5fd81de505bdaf3db5f86937063329e79899fa |
|
| MD5 | 3da3335f84b0b6ffa1a3e08b2a93791f |
|
| BLAKE2b-256 | 9b553e680b46a78f094dbdeafeb8d7469dc471cfa4f04f342170e84140eecccc |
File details
Details for the file pandasecharts-0.5-py3-none-any.whl.
File metadata
- Download URL: pandasecharts-0.5-py3-none-any.whl
- Upload date:
- Size: 15.7 kB
- Tags: Python 3
- Uploaded using Trusted Publishing? No
- Uploaded via: twine/3.6.0 importlib_metadata/4.8.2 pkginfo/1.8.1 requests/2.26.0 requests-toolbelt/0.9.1 tqdm/4.62.3 CPython/3.8.9
File hashes
| Algorithm | Hash digest | |
|---|---|---|
| SHA256 | c379a1251b3da988003e3a5246290981023ae5d8a6471eb295746d01b685e764 |
|
| MD5 | 369f29257a7b6104afa605a32c053116 |
|
| BLAKE2b-256 | 9e395ed3716d454f972e7b8efc8c0236e1e97e119c6486ff2f1e34b824bf9d1e |


