Automated Machine Learning for Humans

Project description
MLJAR Automated Machine Learning for Humans


Documentation: https://supervised.mljar.com/
Source Code: https://github.com/mljar/mljar-supervised
Looking for commercial support: Please contact us by email for details
Watch full AutoML training in Python under 2 minutes. The training is done in MLJAR Studio.

Table of Contents
- Automated Machine Learning
- What's good in it?
- AutoML Web App with GUI
- Automatic Documentation
- Available Modes
- Fairness Aware Training
- Examples
- FAQ
- Documentation
- Installation
- Demo
- Contributing
- Cite
- License
- Commercial support
- MLJAR
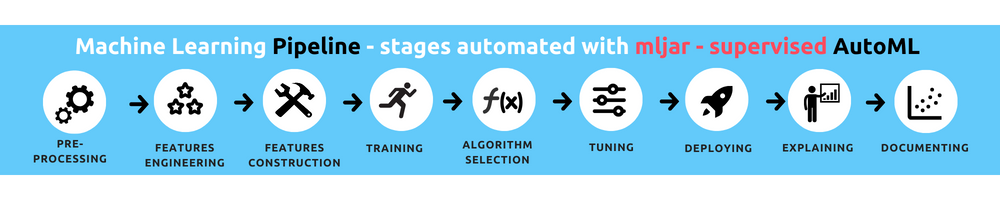
Automated Machine Learning
The mljar-supervised is an Automated Machine Learning Python package that works with tabular data. It is designed to save time for a data scientist. It abstracts the common way to preprocess the data, construct the machine learning models, and perform hyper-parameters tuning to find the best model :trophy:. It is no black box, as you can see exactly how the ML pipeline is constructed (with a detailed Markdown report for each ML model).
The mljar-supervised will help you with:
- explaining and understanding your data (Automatic Exploratory Data Analysis),
- trying many different machine learning models (Algorithm Selection and Hyper-Parameters tuning),
- creating Markdown reports from analysis with details about all models (Automatic-Documentation),
- saving, re-running, and loading the analysis and ML models.
It has four built-in modes of work:
Explainmode, which is ideal for explaining and understanding the data, with many data explanations, like decision trees visualization, linear models coefficients display, permutation importance, and SHAP explanations of data,Performfor building ML pipelines to use in production,Competemode that trains highly-tuned ML models with ensembling and stacking, with the purpose to use in ML competitions.Optunamode can be used to search for highly-tuned ML models should be used when the performance is the most important, and computation time is not limited (it is available from version0.10.0)
Of course, you can further customize the details of each mode to meet the requirements.
What's good in it?
- It uses many algorithms:
Baseline,Linear,Random Forest,Extra Trees,LightGBM,Xgboost,CatBoost,Neural Networks, andNearest Neighbors. - It can compute Ensemble based on a greedy algorithm from Caruana paper.
- It can stack models to build a level 2 ensemble (available in
Competemode or after setting thestack_modelsparameter). - It can do features preprocessing, like missing values imputation and converting categoricals. What is more, it can also handle target values preprocessing.
- It can do advanced features engineering, like Golden Features, Features Selection, Text and Time Transformations.
- It can tune hyper-parameters with a
not-so-random-searchalgorithm (random-search over a defined set of values) and hill climbing to fine-tune final models. - It can compute the
Baselinefor your data so that you will know if you need Machine Learning or not! - It has extensive explanations. This package is training simple
Decision Treeswithmax_depth <= 5, so you can easily visualize them with amazing dtreeviz to better understand your data. - The
mljar-superviseduses simple linear regression and includes its coefficients in the summary report, so you can check which features are used the most in the linear model. - It cares about the explainability of models: for every algorithm, the feature importance is computed based on permutation. Additionally, for every algorithm, the SHAP explanations are computed: feature importance, dependence plots, and decision plots (explanations can be switched off with the
explain_levelparameter). - There is automatic documentation for every ML experiment run with AutoML. The
mljar-supervisedcreates markdown reports from AutoML training full of ML details, metrics, and charts.
AutoML Web App with User Interface
We created a Web App with GUI, so you don't need to write any code 🐍. Just upload your data. Please check the Web App at github.com/mljar/automl-app. You can run this Web App locally on your computer, so your data is safe and secure :cat:

Automatic Documentation
The AutoML Report
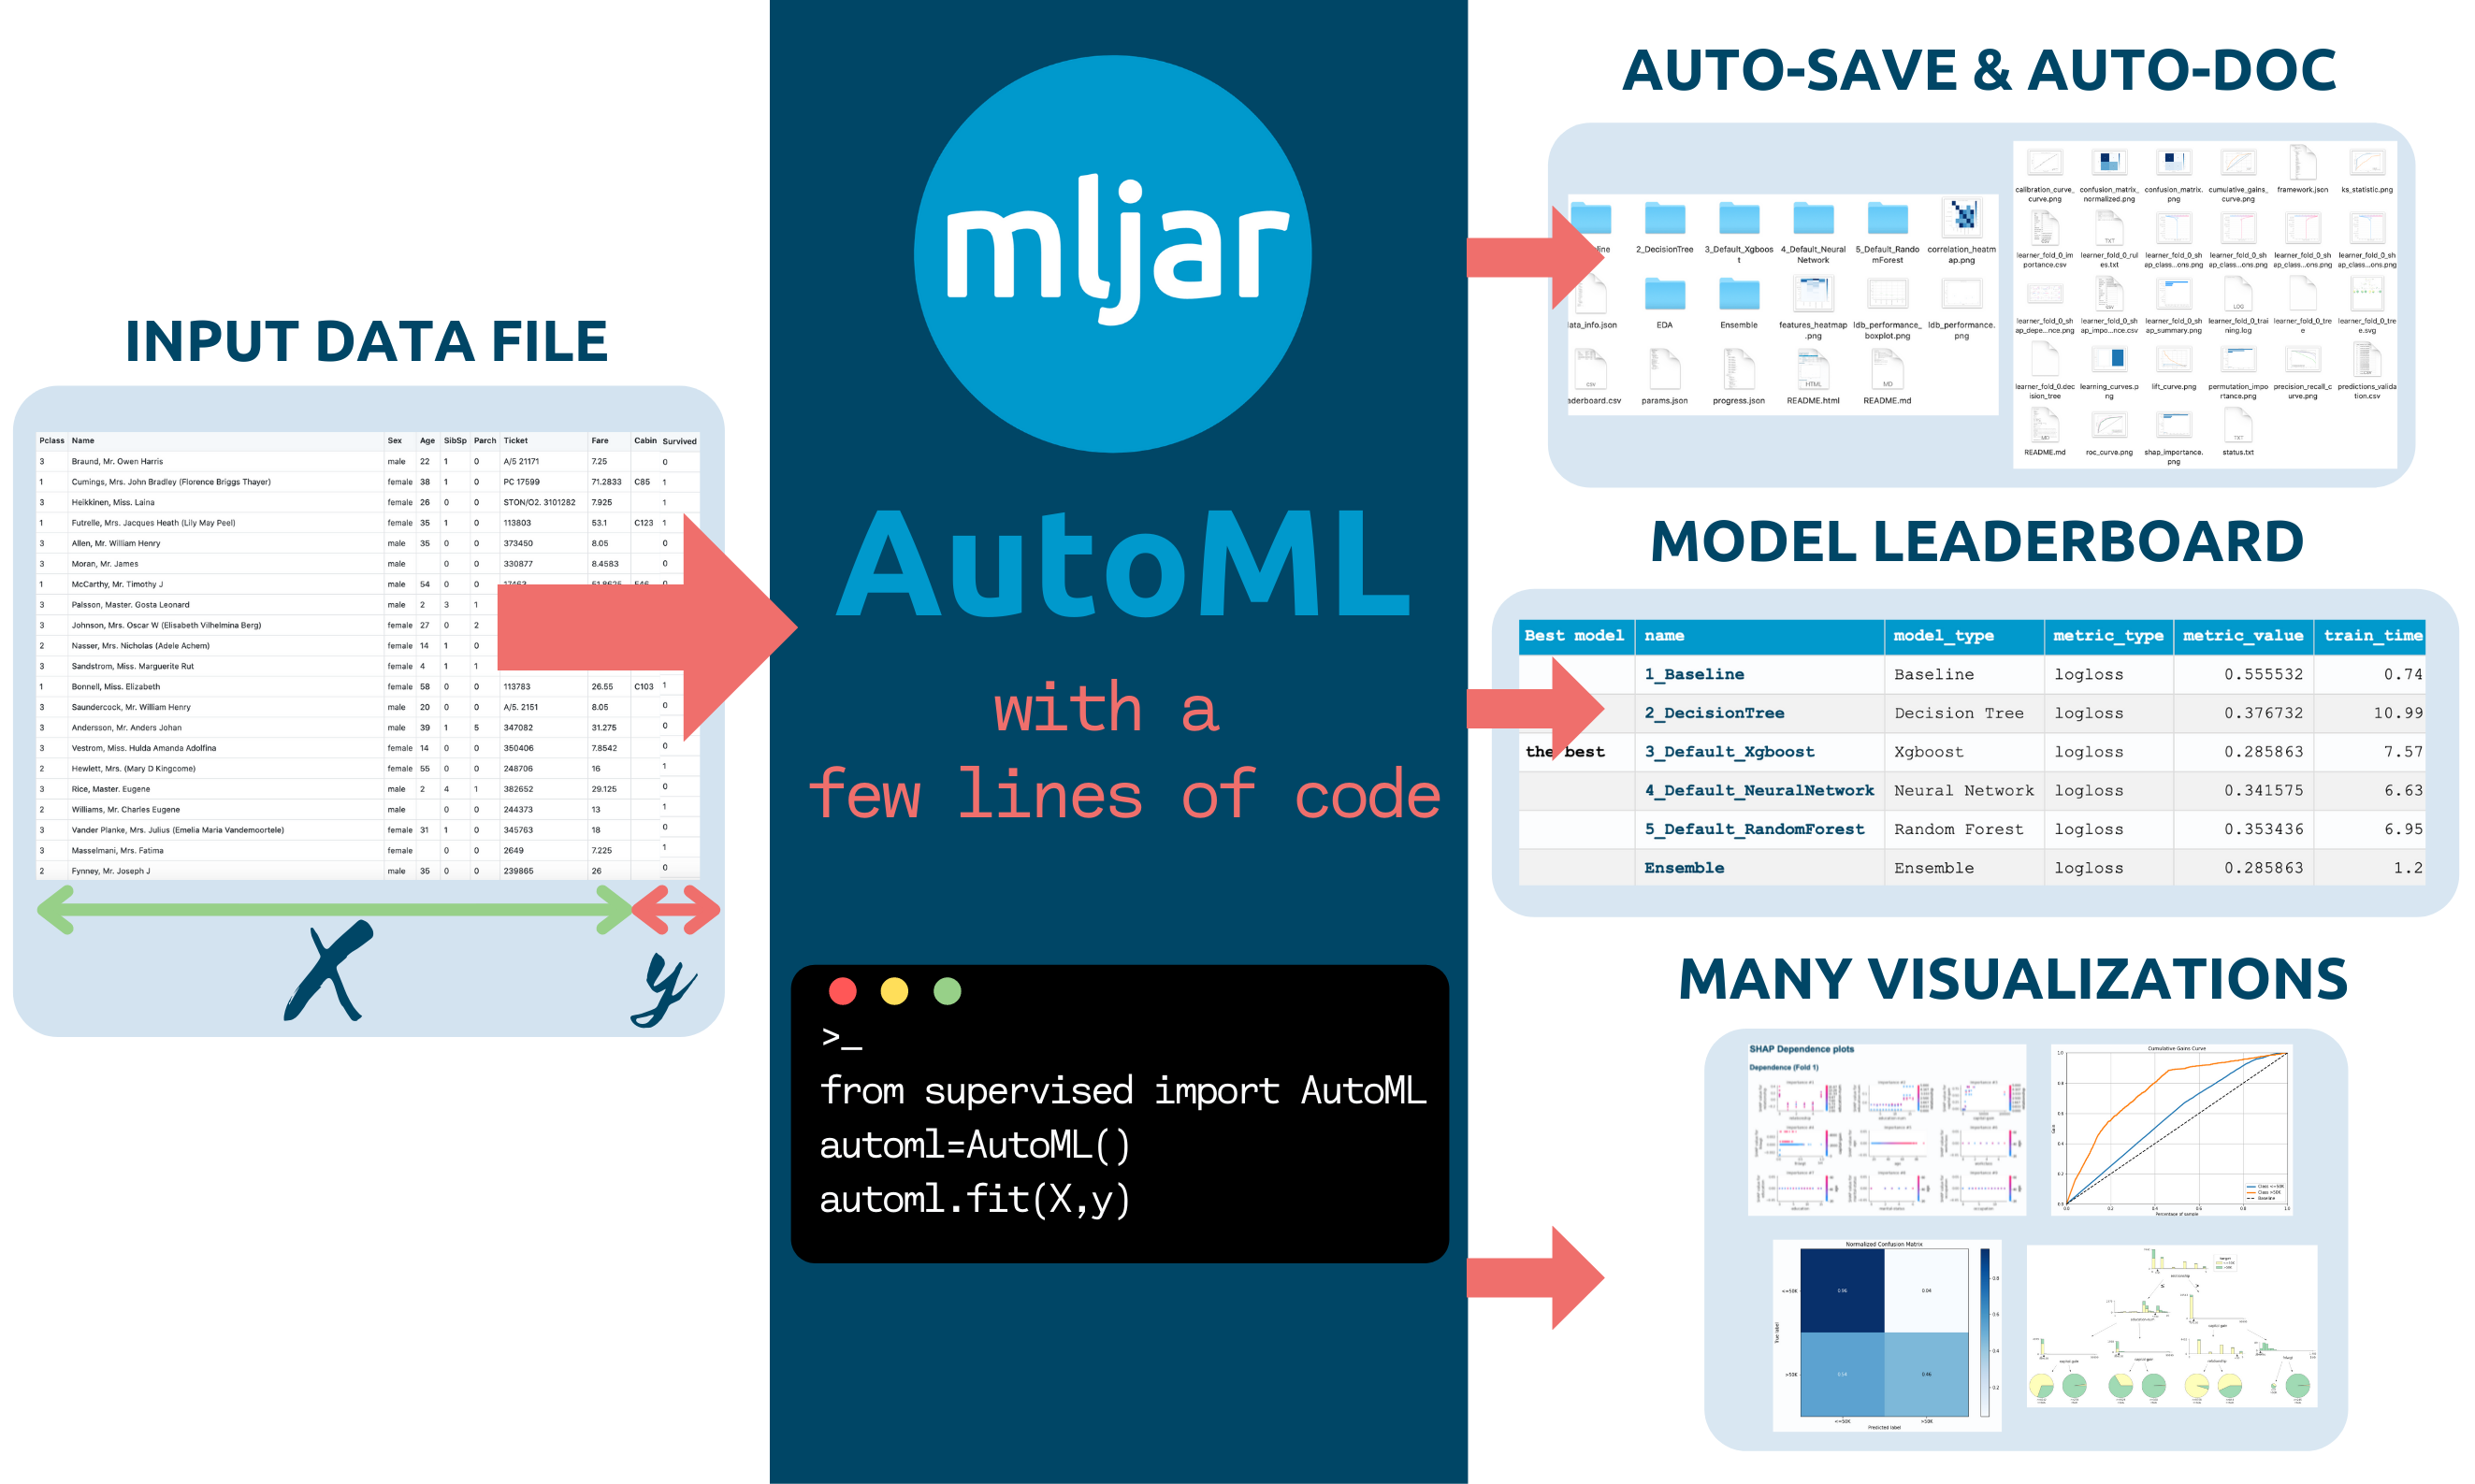
The report from running AutoML will contain the table with information about each model score and the time needed to train the model. There is a link for each model, which you can click to see the model's details. The performance of all ML models is presented as scatter and box plots so you can visually inspect which algorithms perform the best :trophy:.

The Decision Tree Report
The example for Decision Tree summary with trees visualization. For classification tasks, additional metrics are provided:
- confusion matrix
- threshold (optimized in the case of binary classification task)
- F1 score
- Accuracy
- Precision, Recall, MCC

The LightGBM Report
The example for LightGBM summary:

Available Modes
In the docs you can find details about AutoML modes that are presented in the table.
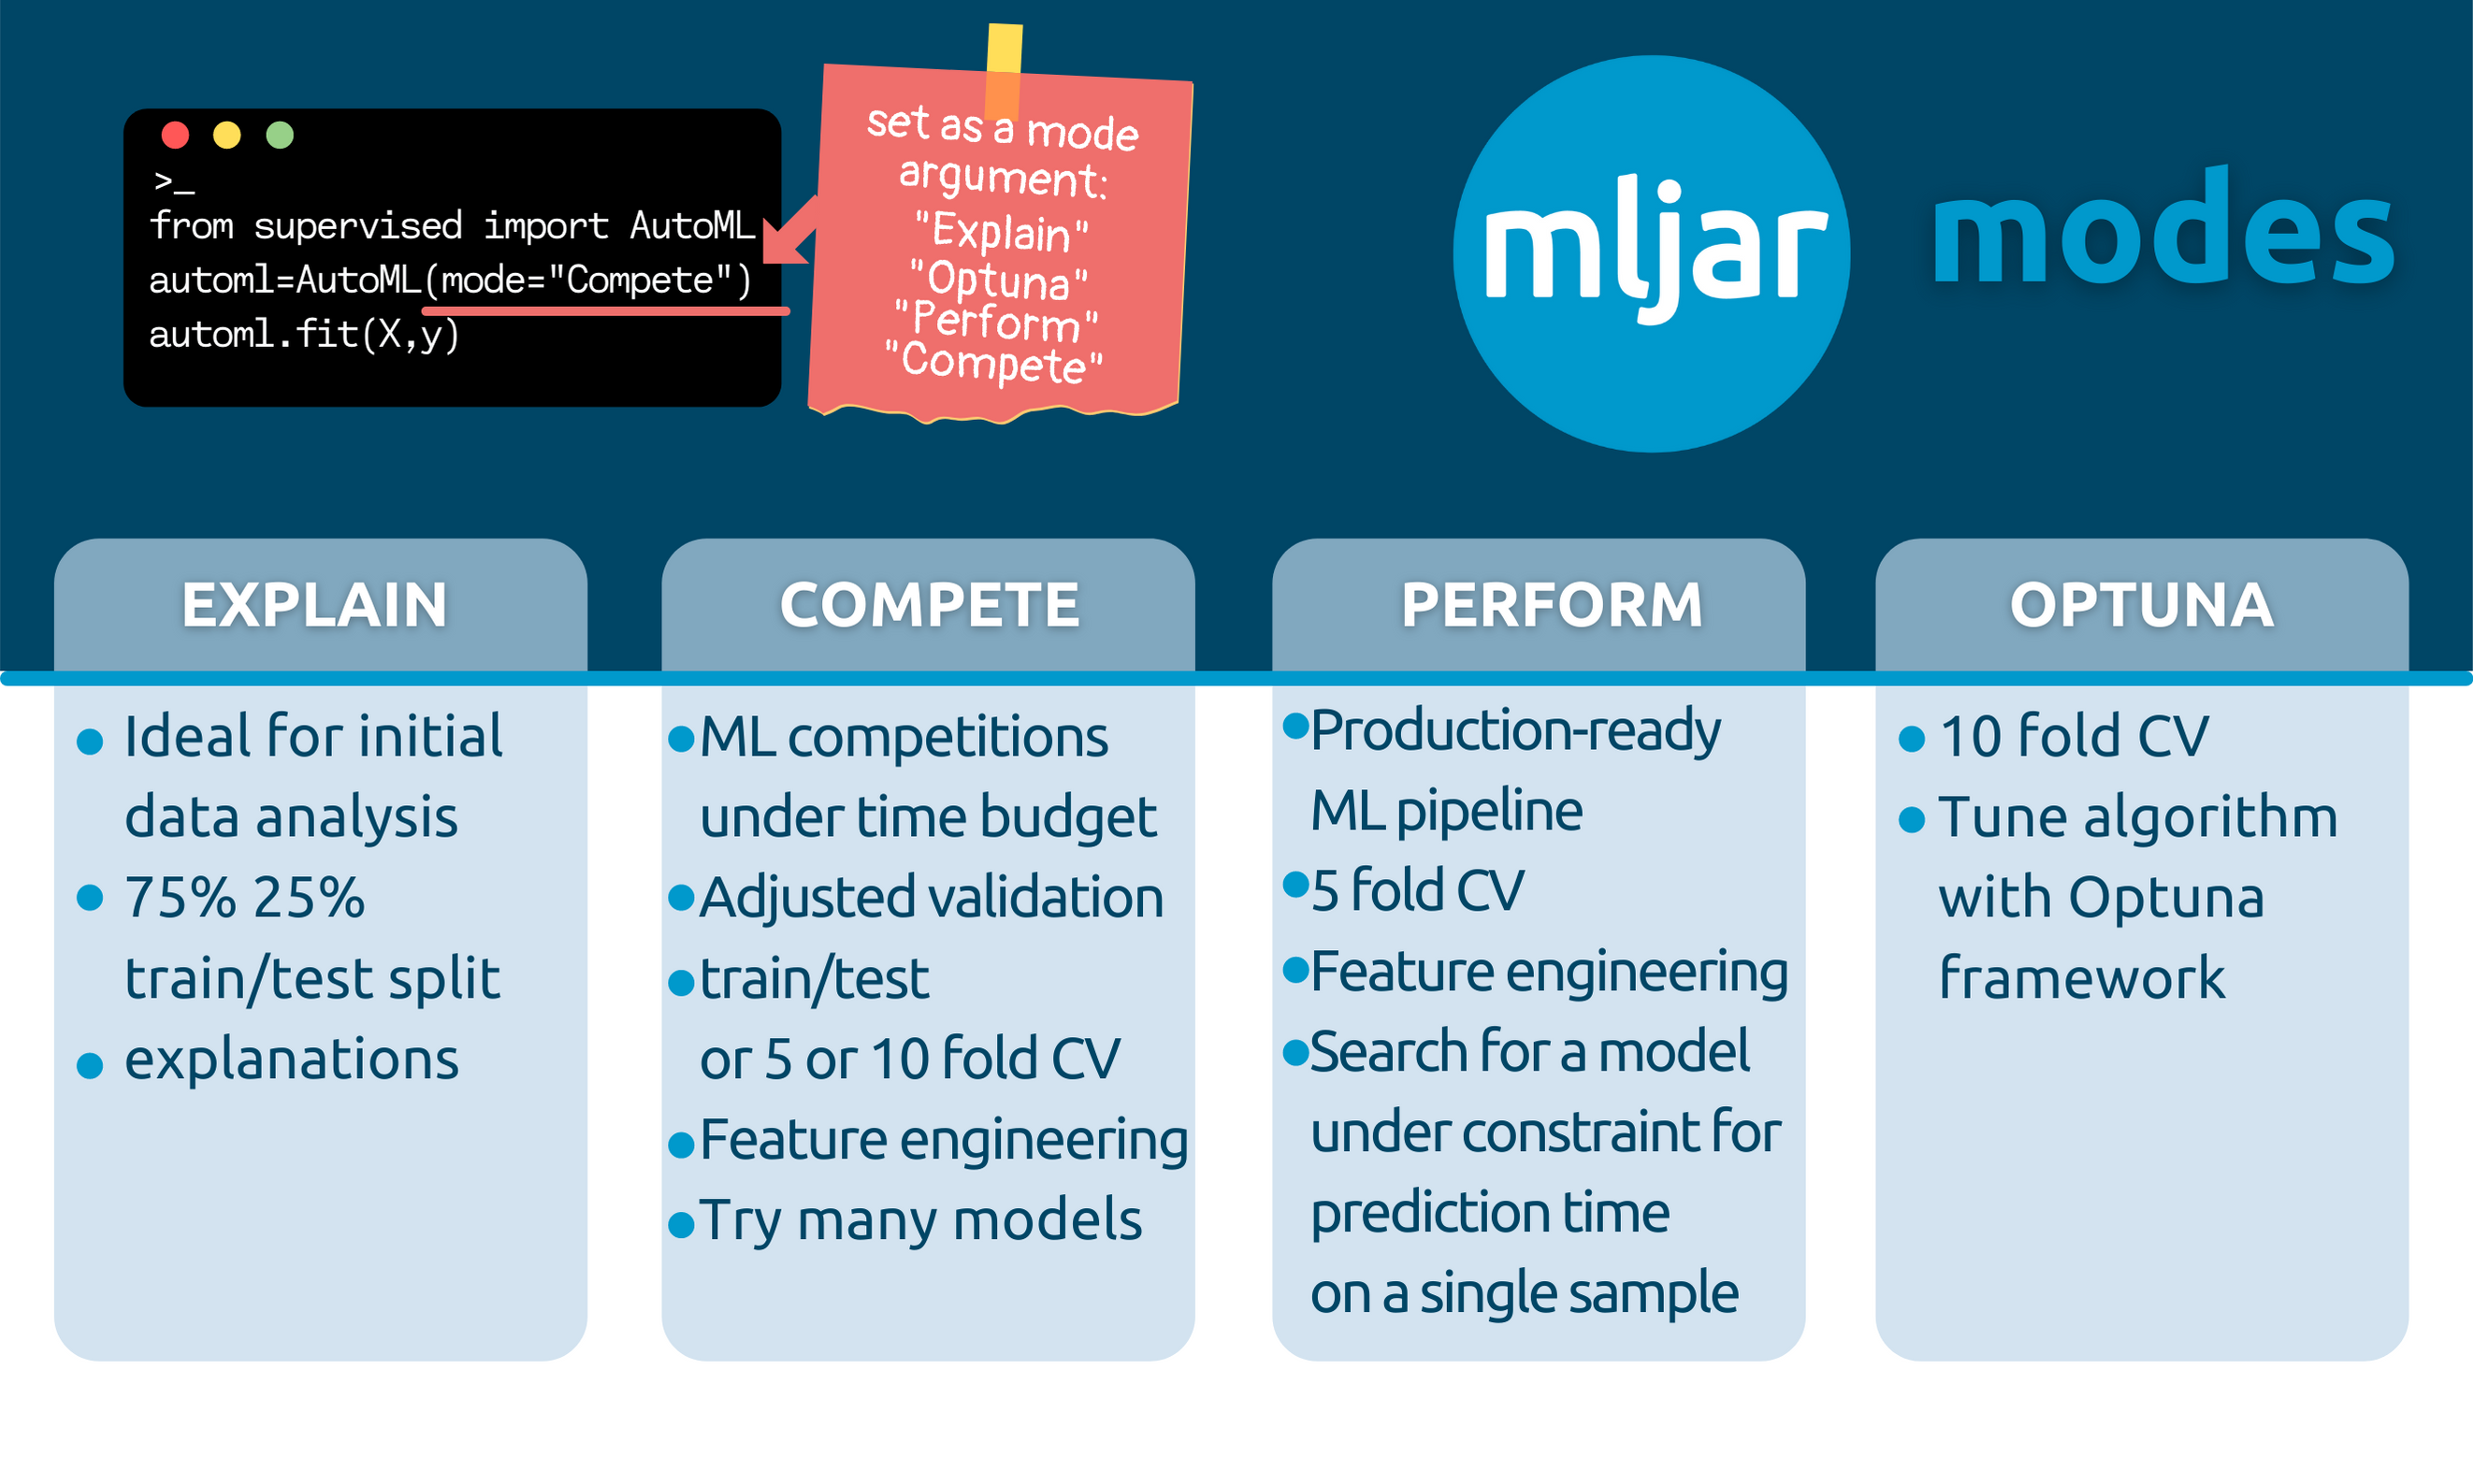
Explain
automl = AutoML(mode="Explain")
It is aimed to be used when the user wants to explain and understand the data.
- It is using 75%/25% train/test split.
- It uses:
Baseline,Linear,Decision Tree,Random Forest,Xgboost, `Neural Network' algorithms, and ensemble. - It has full explanations: learning curves, importance plots, and SHAP plots.
Perform
automl = AutoML(mode="Perform")
It should be used when the user wants to train a model that will be used in real-life use cases.
- It uses a 5-fold CV.
- It uses:
Linear,Random Forest,LightGBM,Xgboost,CatBoost, andNeural Network. It uses ensembling. - It has learning curves and importance plots in reports.
Compete
automl = AutoML(mode="Compete")
It should be used for machine learning competitions.
- It adapts the validation strategy depending on dataset size and
total_time_limit. It can be: a train/test split (80/20), 5-fold CV or 10-fold CV. - It is using:
Linear,Decision Tree,Random Forest,Extra Trees,LightGBM,Xgboost,CatBoost,Neural Network, andNearest Neighbors. It uses ensemble and stacking. - It has only learning curves in the reports.
Optuna
automl = AutoML(mode="Optuna", optuna_time_budget=3600)
It should be used when the performance is the most important and time is not limited.
- It uses a 10-fold CV
- It uses:
Random Forest,Extra Trees,LightGBM,Xgboost, andCatBoost. Those algorithms are tuned byOptunaframework foroptuna_time_budgetseconds, each. Algorithms are tuned with original data, without advanced feature engineering. - It uses advanced feature engineering, stacking and ensembling. The hyperparameters found for original data are reused with those steps.
- It produces learning curves in the reports.
How to save and load AutoML?
All models in the AutoML are saved and loaded automatically. No need to call save() or load().
Example:
Train AutoML
automl = AutoML(results_path="AutoML_classifier")
automl.fit(X, y)
You will have all models saved in the AutoML_classifier directory. Each model will have a separate directory with the README.md file with all details from the training.
Compute predictions
automl = AutoML(results_path="AutoML_classifier")
automl.predict(X)
The AutoML automatically loads models from the results_path directory. If you will call fit() on already trained AutoML then you will get a warning message that AutoML is already fitted.
Why do you automatically save all models?
All models are automatically saved to be able to restore the training after interruption. For example, you are training AutoML for 48 hours, and after 47 hours, there is some unexpected interruption. In MLJAR AutoML you just call the same training code after the interruption and AutoML reloads already trained models and finishes the training.
Supported evaluation metrics (eval_metric argument in AutoML())
- for binary classification:
logloss,auc,f1,average_precision,accuracy- default islogloss - for multiclass classification:
logloss,f1,accuracy- default islogloss - for regression:
rmse,mse,mae,r2,mape,spearman,pearson- default isrmse
If you don't find the eval_metric that you need, please add a new issue. We will add it.
Fairness Aware Training
Starting from version 1.0.0 AutoML can optimize the Machine Learning pipeline with sensitive features. There are the following fairness related arguments in the AutoML constructor:
fairness_metric- metric which will be used to decide if the model is fair,fairness_threshold- threshold used in decision about model fairness,privileged_groups- privileged groups used in fairness metrics computation,underprivileged_groups- underprivileged groups used in fairness metrics computation.
The fit() method accepts sensitive_features. When sensitive features are passed to AutoML, the best model will be selected among fair models only. In the AutoML reports, additional information about fairness metrics will be added. The MLJAR AutoML supports two methods for bias mitigation:
- Sample Weighting - assigns weights to samples to treat samples equally,
- Smart Grid Search - similar to Sample Weighting, where different weights are checked to optimize fairness metric.
The fair ML building can be used with all algorithms, including Ensemble and Stacked Ensemble. We support three Machine Learning tasks:
- binary classification,
- mutliclass classification,
- regression.
Example code:
from sklearn.model_selection import train_test_split
from sklearn.datasets import fetch_openml
from supervised.automl import AutoML

data = fetch_openml(data_id=1590, as_frame=True)
X = data.data
y = (data.target == ">50K") * 1
sensitive_features = X[["sex"]]

X_train, X_test, y_train, y_test, S_train, S_test = train_test_split(
    X, y, sensitive_features, stratify=y, test_size=0.75, random_state=42
)

automl = AutoML(
    algorithms=[
        "Xgboost"
    ],
    train_ensemble=False,
    fairness_metric="demographic_parity_ratio",
    fairness_threshold=0.8,
    privileged_groups = [{"sex": "Male"}],
    underprivileged_groups = [{"sex": "Female"}],
)

automl.fit(X_train, y_train, sensitive_features=S_train)
You can read more about fairness aware AutoML training in our article https://mljar.com/blog/fairness-machine-learning/
Examples
:point_right: Binary Classification Example
There is a simple interface available with fit and predict methods.
import pandas as pd
from sklearn.model_selection import train_test_split
from supervised.automl import AutoML

df = pd.read_csv(
    "https://raw.githubusercontent.com/pplonski/datasets-for-start/master/adult/data.csv",
    skipinitialspace=True,
)
X_train, X_test, y_train, y_test = train_test_split(
    df[df.columns[:-1]], df["income"], test_size=0.25
)

automl = AutoML()
automl.fit(X_train, y_train)

predictions = automl.predict(X_test)
AutoML fit will print:
Create directory AutoML_1
AutoML task to be solved: binary_classification
AutoML will use algorithms: ['Baseline', 'Linear', 'Decision Tree', 'Random Forest', 'Xgboost', 'Neural Network']
AutoML will optimize for metric: logloss
1_Baseline final logloss 0.5519845471086654 time 0.08 seconds
2_DecisionTree final logloss 0.3655910192804364 time 10.28 seconds
3_Linear final logloss 0.38139916864708445 time 3.19 seconds
4_Default_RandomForest final logloss 0.2975204390214936 time 79.19 seconds
5_Default_Xgboost final logloss 0.2731086827200411 time 5.17 seconds
6_Default_NeuralNetwork final logloss 0.319812276905242 time 21.19 seconds
Ensemble final logloss 0.2731086821194617 time 1.43 seconds
- the AutoML results in Markdown report
- the Xgboost Markdown report, please take a look at amazing dependence plots produced by SHAP package :sparkling_heart:
- the Decision Tree Markdown report, please take a look at beautiful tree visualization :sparkles:
- the Logistic Regression Markdown report, please take a look at coefficients table, and you can compare the SHAP plots between (Xgboost, Decision Tree and Logistic Regression) :coffee:
:point_right: Multi-Class Classification Example
The example code for classification of the optical recognition of handwritten digits dataset. Running this code in less than 30 minutes will result in test accuracy ~98%.
import pandas as pd
# scikit learn utilites
from sklearn.datasets import load_digits
from sklearn.metrics import accuracy_score
from sklearn.model_selection import train_test_split
# mljar-supervised package
from supervised.automl import AutoML

# load the data
digits = load_digits()
X_train, X_test, y_train, y_test = train_test_split(
    pd.DataFrame(digits.data), digits.target, stratify=digits.target, test_size=0.25,
    random_state=123
)

# train models with AutoML
automl = AutoML(mode="Perform")
automl.fit(X_train, y_train)

# compute the accuracy on test data
predictions = automl.predict_all(X_test)
print(predictions.head())
print("Test accuracy:", accuracy_score(y_test, predictions["label"].astype(int)))
:point_right: Regression Example
Regression example on California Housing house prices data.
import numpy as np
import pandas as pd
from sklearn.datasets import fetch_california_housing
from sklearn.model_selection import train_test_split
from sklearn.metrics import mean_squared_error
from supervised.automl import AutoML # mljar-supervised

# Load the data
housing = fetch_california_housing()
X_train, X_test, y_train, y_test = train_test_split(
    pd.DataFrame(housing.data, columns=housing.feature_names),
    housing.target,
    test_size=0.25,
    random_state=123,
)

# train models with AutoML
automl = AutoML(mode="Explain")
automl.fit(X_train, y_train)

# compute the MSE on test data
predictions = automl.predict(X_test)
print("Test MSE:", mean_squared_error(y_test, predictions))
:point_right: More Examples
- Income classification - it is a binary classification task on census data
- Iris classification - it is a multiclass classification on Iris flowers data
- House price regression - it is a regression task on Boston houses data
FAQ
What method is used for hyperparameters optimization?
- For modes: `Explain`, `Perform`, and `Compete` there is used a random search method combined with hill climbing. In this approach, all checked models are saved and used for building Ensemble. - For mode: `Optuna` the Optuna framework is used. It uses using TPE sampler for tuning. Models checked during the Optuna hyperparameters search are not saved, only the best model is saved (the final model from tuning). You can check the details about checked hyperparameters from optuna by checking study files in the `optuna` directory in your AutoML `results_path`.How to save and load AutoML?
The save and load of AutoML models is automatic. All models created during AutoML training are saved in the directory set in results_path (argument of AutoML() constructor). If there is no results_path set, then the directory is created based on following name convention: AutoML_{number} the number will be number from 1 to 1000 (depends which directory name will be free).
Example save and load:
automl = AutoML(results_path='AutoML_1')
automl.fit(X, y)
The all models from AutoML are saved in AutoML_1 directory.
To load models:
automl = AutoML(results_path='AutoML_1')
automl.predict(X)
How to set ML task (select between classification or regression)?
The MLJAR AutoML can work with:
- binary classification
- multi-class classification
- regression
The ML task detection is automatic based on target values. There can be situation if you want to manually force AutoML to select the ML task, then you need to set ml_task parameter. It can be set to 'binary_classification', 'multiclass_classification', 'regression'.
Example:
automl = AutoML(ml_task='regression')
automl.fit(X, y)
In the above example the regression model will be fitted.
How to reuse Optuna hyperparameters?
You can reuse Optuna hyperparameters that were found in other AutoML training. You need to pass them in optuna_init_params argument. All hyperparameters found during Optuna tuning are saved in the optuna/optuna.json file (inside results_path directory).
Example:
optuna_init = json.loads(open('previous_AutoML_training/optuna/optuna.json').read())

automl = AutoML(
    mode='Optuna',
    optuna_init_params=optuna_init
)
automl.fit(X, y)
When reusing Optuna hyperparameters the Optuna tuning is simply skipped. The model will be trained with hyperparameters set in optuna_init_params. Right now there is no option to continue Optuna tuning with seed parameters.
How to know the order of classes for binary or multiclass problem when using predict_proba?
To get predicted probabilites with information about class label please use the predict_all() method. It returns the pandas DataFrame with class names in the columns. The order of predicted columns is the same in the predict_proba() and predict_all() methods. The predict_all() method will additionaly have the column with the predicted class label.
Documentation
For details please check mljar-supervised docs.
Installation
From PyPi repository:
pip install mljar-supervised
To install this package with conda run:
conda install -c conda-forge mljar-supervised
From source code:
git clone https://github.com/mljar/mljar-supervised.git
cd mljar-supervised
python setup.py install
Installation for development
git clone https://github.com/mljar/mljar-supervised.git
virtualenv venv --python=python3.6
source venv/bin/activate
pip install -r requirements.txt
pip install -r requirements_dev.txt
Running in the docker:
FROM python:3.7-slim-buster
RUN apt-get update && apt-get -y update
RUN apt-get install -y build-essential python3-pip python3-dev
RUN pip3 -q install pip --upgrade
RUN pip3 install mljar-supervised jupyter
CMD ["jupyter", "notebook", "--port=8888", "--no-browser", "--ip=0.0.0.0", "--allow-root"]
Install from GitHub with pip:
pip install -q -U git+https://github.com/mljar/mljar-supervised.git@master
Demo
In the below demo GIF you will see:
- MLJAR AutoML trained in Jupyter Notebook on the Titanic dataset
- overview of created files
- a showcase of selected plots created during AutoML training
- algorithm comparison report along with their plots
- example of README file and CSV file with results
Contributing
To get started take a look at our Contribution Guide for information about our process and where you can fit in!
Contributors

Cite
Would you like to cite MLJAR? Great! :)
You can cite MLJAR as follows:
@misc{mljar,
  author    = {Aleksandra P\l{}o\'{n}ska and Piotr P\l{}o\'{n}ski},
  year      = {2021},
  publisher = {MLJAR},
  address   = {\L{}apy, Poland},
  title     = {MLJAR: State-of-the-art Automated Machine Learning Framework for Tabular Data.  Version 0.10.3},
  url       = {https://github.com/mljar/mljar-supervised}
}
Would love to hear from you about how have you used MLJAR AutoML in your project.
Please feel free to let us know at

License
The mljar-supervised is provided with MIT license.
Commercial support
Looking for commercial support? Do you need new feature implementation? Please contact us by email for details.
MLJAR

The mljar-supervised is an open-source project created by MLJAR. We care about ease of use in Machine Learning.
The mljar.com provides a beautiful and simple user interface for building machine learning models.


