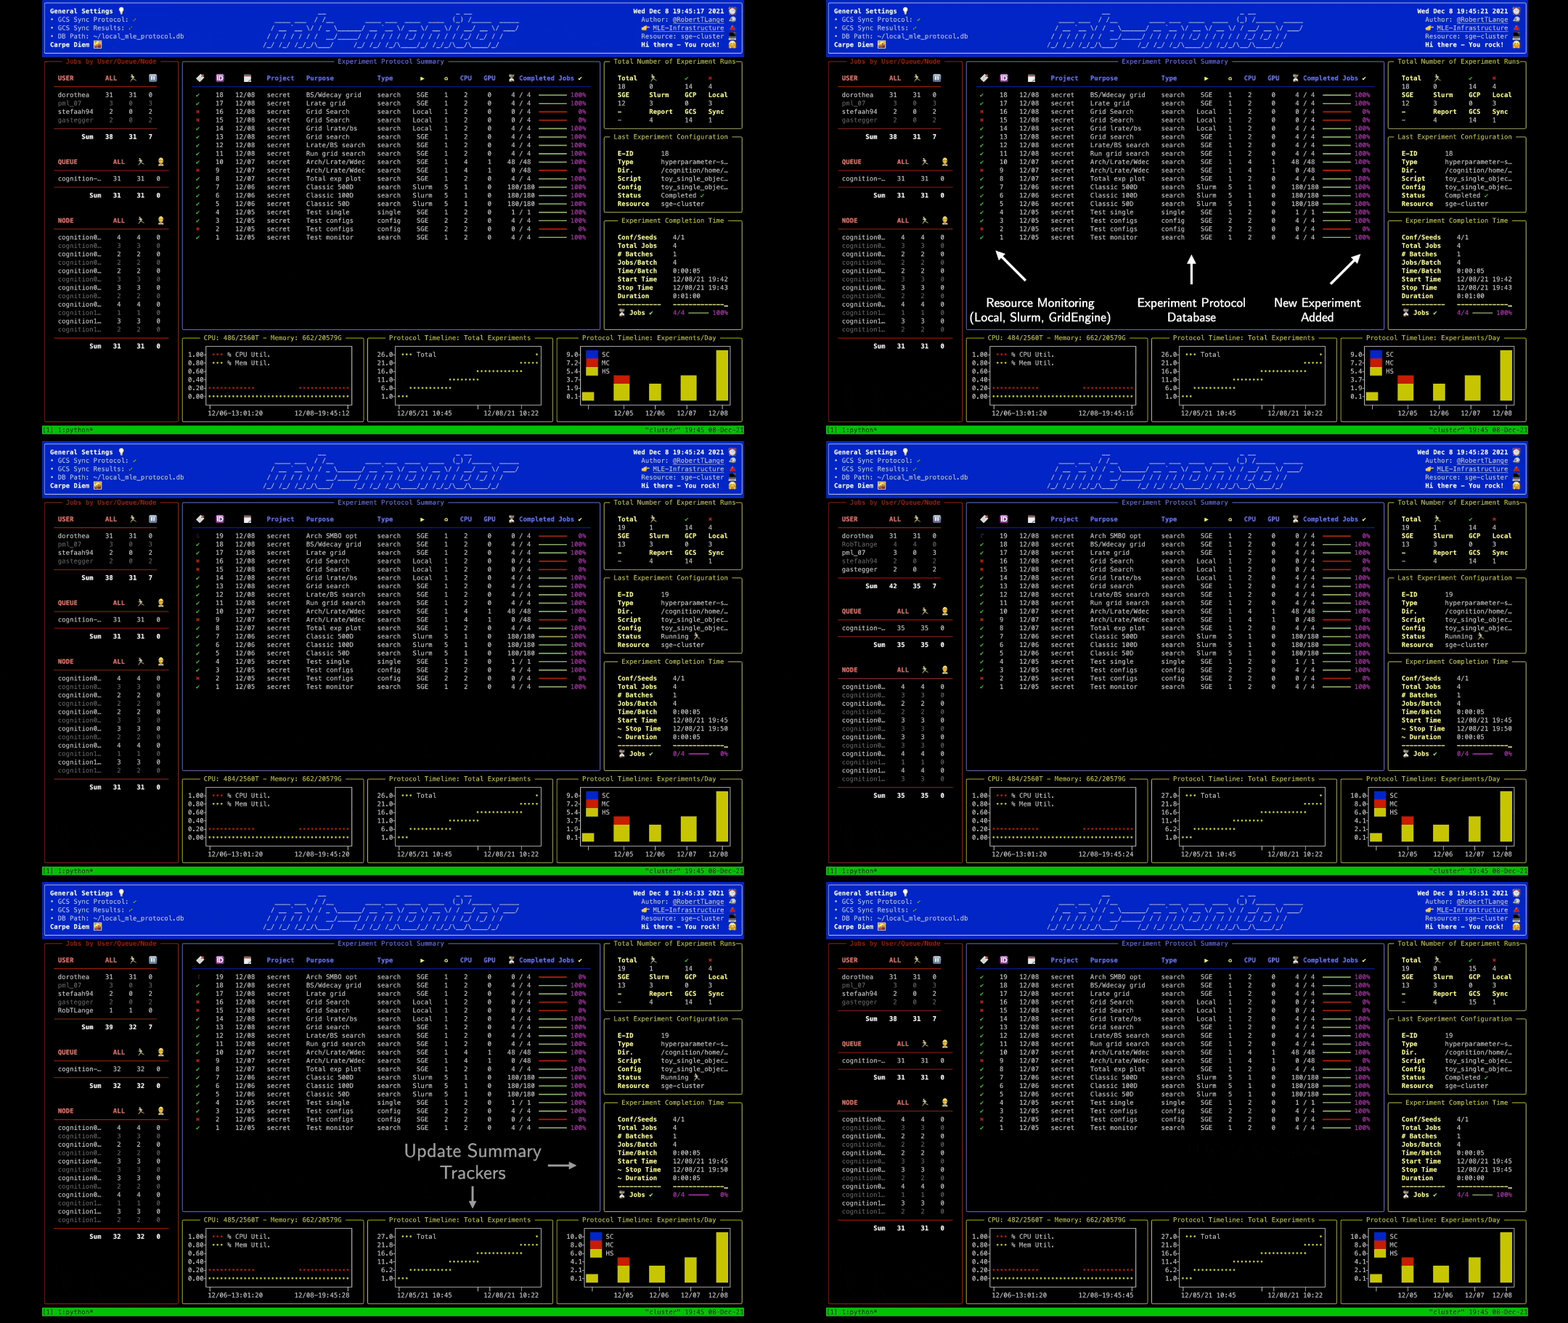
Machine Learning Experiment Resource Monitoring
Project description
Lightweight Experiment & Resource Monitoring 📺
"Did I already run this experiment before? How many resources are currently available on my cluster?" If these are common questions you encounter during your daily life as a researcher, then mle-monitor is made for you. It provides a lightweight API for tracking your experiments using a pickle protocol database (e.g. for hyperparameter searches and/or multi-configuration/multi-seed runs). Furthermore, it comes with built-in resource monitoring on Slurm/Grid Engine clusters and local machines/servers.
mle-monitor provides three core functionalities:
MLEProtocol: A composable protocol database API for ML experiments.MLEResource: A tool for obtaining server/cluster usage statistics.MLEDashboard: A dashboard visualizing resource usage & experiment protocol.
To get started I recommend checking out the colab notebook and an example workflow.

MLEProtocol: Keeping Track of Your Experiments 📝
from mle_monitor import MLEProtocol

# Load protocol database or create new one -> print summary
protocol_db = MLEProtocol("mle_protocol.db", verbose=False)
protocol_db.summary(tail=10, verbose=True)

# Draft data to store in protocol & add it to the protocol
meta_data = {
    "purpose": "Grid search",  # Purpose of experiment
    "project_name": "MNIST",  # Project name of experiment
    "experiment_type": "hyperparameter-search",  # Type of experiment
    "experiment_dir": "experiments/logs",  # Experiment directory
    "num_total_jobs": 10,  # Number of total jobs to run
    ...
}
new_experiment_id = protocol_db.add(meta_data)

# ... train your 10 (pseudo) networks/complete respective jobs
for i in range(10):
    protocol_db.update_progress_bar(new_experiment_id)

# Wrap up an experiment (store completion time, etc.)
protocol_db.complete(new_experiment_id)
The meta data can contain the following keys:
| Search Type | Description | Default |
|---|---|---|
purpose |
Purpose of experiment | 'None provided' |
project_name |
Project name of experiment | 'default' |
exec_resource |
Resource jobs are run on | 'local' |
experiment_dir |
Experiment log storage directory | 'experiments' |
experiment_type |
Type of experiment to run | 'single' |
base_fname |
Main code script to execute | 'main.py' |
config_fname |
Config file path of experiment | 'base_config.yaml' |
num_seeds |
Number of evaluations seeds | 1 |
num_total_jobs |
Number of total jobs to run | 1 |
num_job_batches |
Number of jobs in single batch | 1 |
num_jobs_per_batch |
Number of sequential job batches | 1 |
time_per_job |
Expected duration: days-hours-minutes | '00:01:00' |
num_cpus |
Number of CPUs used in job | 1 |
num_gpus |
Number of GPUs used in job | 0 |
Additionally you can synchronize the protocol with a Google Cloud Storage (GCS) bucket by providing cloud_settings. In this case also the results stored in experiment_dir will be uploaded to the GCS bucket, when you call protocol.complete().
# Define GCS settings - requires 'GOOGLE_APPLICATION_CREDENTIALS' env var.
cloud_settings = {
    "project_name": "mle-toolbox",  # GCP project name
    "bucket_name": "mle-protocol",  # GCS bucket name
    "use_protocol_sync": True,  # Whether to sync the protocol to GCS
    "use_results_storage": True,  # Whether to sync experiment_dir to GCS
}
protocol_db = MLEProtocol("mle_protocol.db", cloud_settings, verbose=True)
The MLEResource: Keeping Track of Your Resources 📉
On Your Local Machine
from mle_monitor import MLEResource

# Instantiate local resource and get usage data
resource = MLEResource(resource_name="local")
resource_data = resource.monitor()
On a Slurm Cluster
resource = MLEResource(
    resource_name="slurm-cluster",
    monitor_config={"partitions": ["<partition-1>", "<partition-2>"]},
)
On a Grid Engine Cluster
resource = MLEResource(
    resource_name="sge-cluster",
    monitor_config={"queues": ["<queue-1>", "<queue-2>"]}
)
The MLEDashboard: Dashboard Visualization 🎞️
from mle_monitor import MLEDashboard

# Instantiate dashboard with protocol and resource
dashboard = MLEDashboard(protocol, resource)

# Get a static snapshot of the protocol & resource utilisation printed in console
dashboard.snapshot()

# Run monitoring in while loop - dashboard
dashboard.live()
Installation ⏳
A PyPI installation is available via:
pip install mle-monitor
If you want to get the most recent commit, please install directly from the repository:
pip install git+https://github.com/mle-infrastructure/mle-monitor.git@main
Citing the MLE-Infrastructure ✏️
If you use mle-monitor in your research, please cite it as follows:
@software{mle_infrastructure2021github,
  author = {Robert Tjarko Lange},
  title = {{MLE-Infrastructure}: A Set of Lightweight Tools for Distributed Machine Learning Experimentation},
  url = {http://github.com/mle-infrastructure},
  year = {2021},
}
Development 👷
You can run the test suite via python -m pytest -vv tests/. If you find a bug or are missing your favourite feature, feel free to create an issue and/or start contributing 🤗.
Project details
Release history Release notifications | RSS feed
Download files
Download the file for your platform. If you're not sure which to choose, learn more about installing packages.
Source Distribution
Built Distribution
Hashes for mle_monitor-0.0.2-py3-none-any.whl
| Algorithm | Hash digest | |
|---|---|---|
| SHA256 | 3b7f907d42730a9b5f191bba5b6c51fb552d20d4d0a40d38cee64a8827a91d11 |
|
| MD5 | 5fbfbef18cfbec8d84aa1472aebc45ee |
|
| BLAKE2b-256 | 4121f941fd419f405dcbecbfe89adfe780cd3df69d6bba3baf746373940f0b93 |


