Functions for automatic scaling of matplotlib plot axes/resolution to data

Project description
 datascale
Functions for automatic scaling of matplotlib line width, marker width, fontsize, and resolution to data


Installation
pip install datascale
or
pip install git+https://github.com/benkrichman/datascale.git@main
Main Functions
plotdatasize()
Scale line width, marker width, or fontsize for plots to correspond directly to the scale of data on either/both plot axes. For more detail see help output:
help(datascale.plotdatasize)
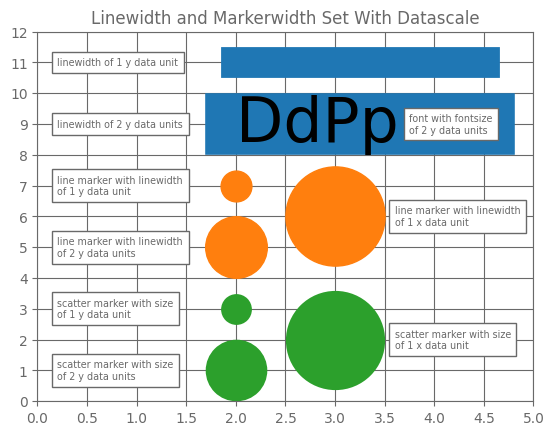
To reproduce this image view test() in datascale.py or use
datascale.test()
plotdatadpi()
Scale dpi of output image to produce a certain number of points per data unit on either/both plot axis/axes. Useful for plots that need a certain amount of detail per axis unit (e.g. geographic projections). For more detail see help output:
help(datascale.plotdatadpi)
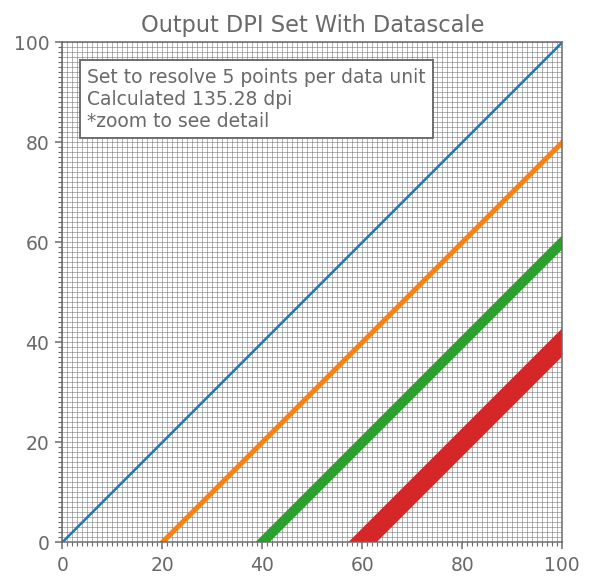
To reproduce this image view test() in datascale.py or use
datascale.test()
Release history Release notifications | RSS feed


Download files
Download the file for your platform. If you're not sure which to choose, learn more about installing packages.
Source Distribution
Built Distribution
Hashes for datascale-1.1.1-py3-none-any.whl
| Algorithm | Hash digest | |
|---|---|---|
| SHA256 | 6ba274d7ba8b34e1f846b343ee2a6d3dc13fcb39aa120284f83e655f2433fa6d |
|
| MD5 | 67c50f2948dc929155549516c3b61e51 |
|
| BLAKE2b-256 | d2426a0ab6f102ca73389e6c32386ac7290b397d59855ae013f6f44931dcc9cd |


