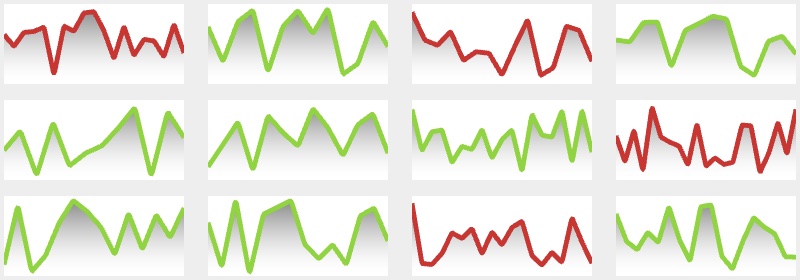
Line
![]()
Dead simple line chart in webgl. Demo
4.8KB after gzip.
Install
$ npm install simple-line-chart
Simple Example
; ;Api
line(options: Options): Line
/* All available options *//** * Data type could be one or two dimensional array * For example: * [100, 250, 70, 180...] * or * [[2010, 100], [2011, 250], [2012, 70], [2013, 180]...] * */Highlights
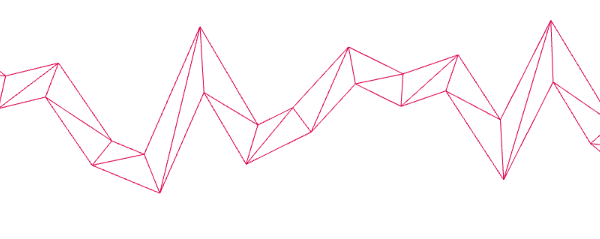
How the line is drawn?
Due to limitations of the OpenGL Core Profile on most platforms, the maximun line width is not constant(mostly is 1.0). So instead of drawing lines with GL_LINES, we build line segments with triangles, the so called Triangulated Lines.
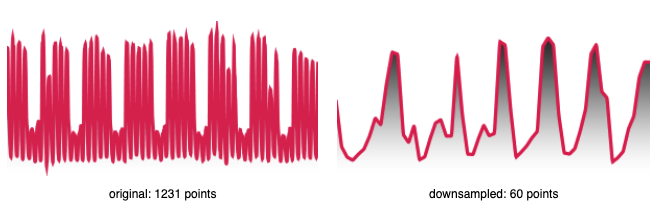
Downsampling
Internally this lib implemented LTTB data downsampling algorithm and use it for better visualisation output. LTTB is short for Largest Triangles Three Buckets, which is introduced on Sveinn Steinarsson's paper Downsampling Time Series for Visual Representation. Check it out for more information.
To turn off the optimization and get the original visualisation, you could set downsample: false.
In addition, this option allows you to set a threahold for output points. You can do that by providing a number.
For example:
; ;
License
MIT (Chuang Yu cyu9960@gmail.com)