
NgxBeautifulCharts


NgxBeautifulCharts is an Angular library for creating charts in your application. The charts are customizable and aesthetically pleasing. Several charts that aren't provided by other Angular chart libraries, such as Sunburst Chart, Gantt Chart and Timeline Chart are offered by NgxBeautifulCharts.
I'm willing to work on more charts, please drop a message if you would like something else or have any specific feature requests.
Demo
Demo available on Stackblitz: https://stackblitz.com/edit/ngx-beautiful-charts-demo
Documentation
Check out the wiki for full documentation.
Install via NPM
![]()
npm i ngx-beautiful-charts
Types of charts offered
- Line Graph
- Multi Line Graph
- Bar Chart
- Clustered Bar Chart
- Pie Chart
- Donut Chart
- Sunburst Chart
- Gantt Chart
- Timeline Chart
How to use them
Line Graph
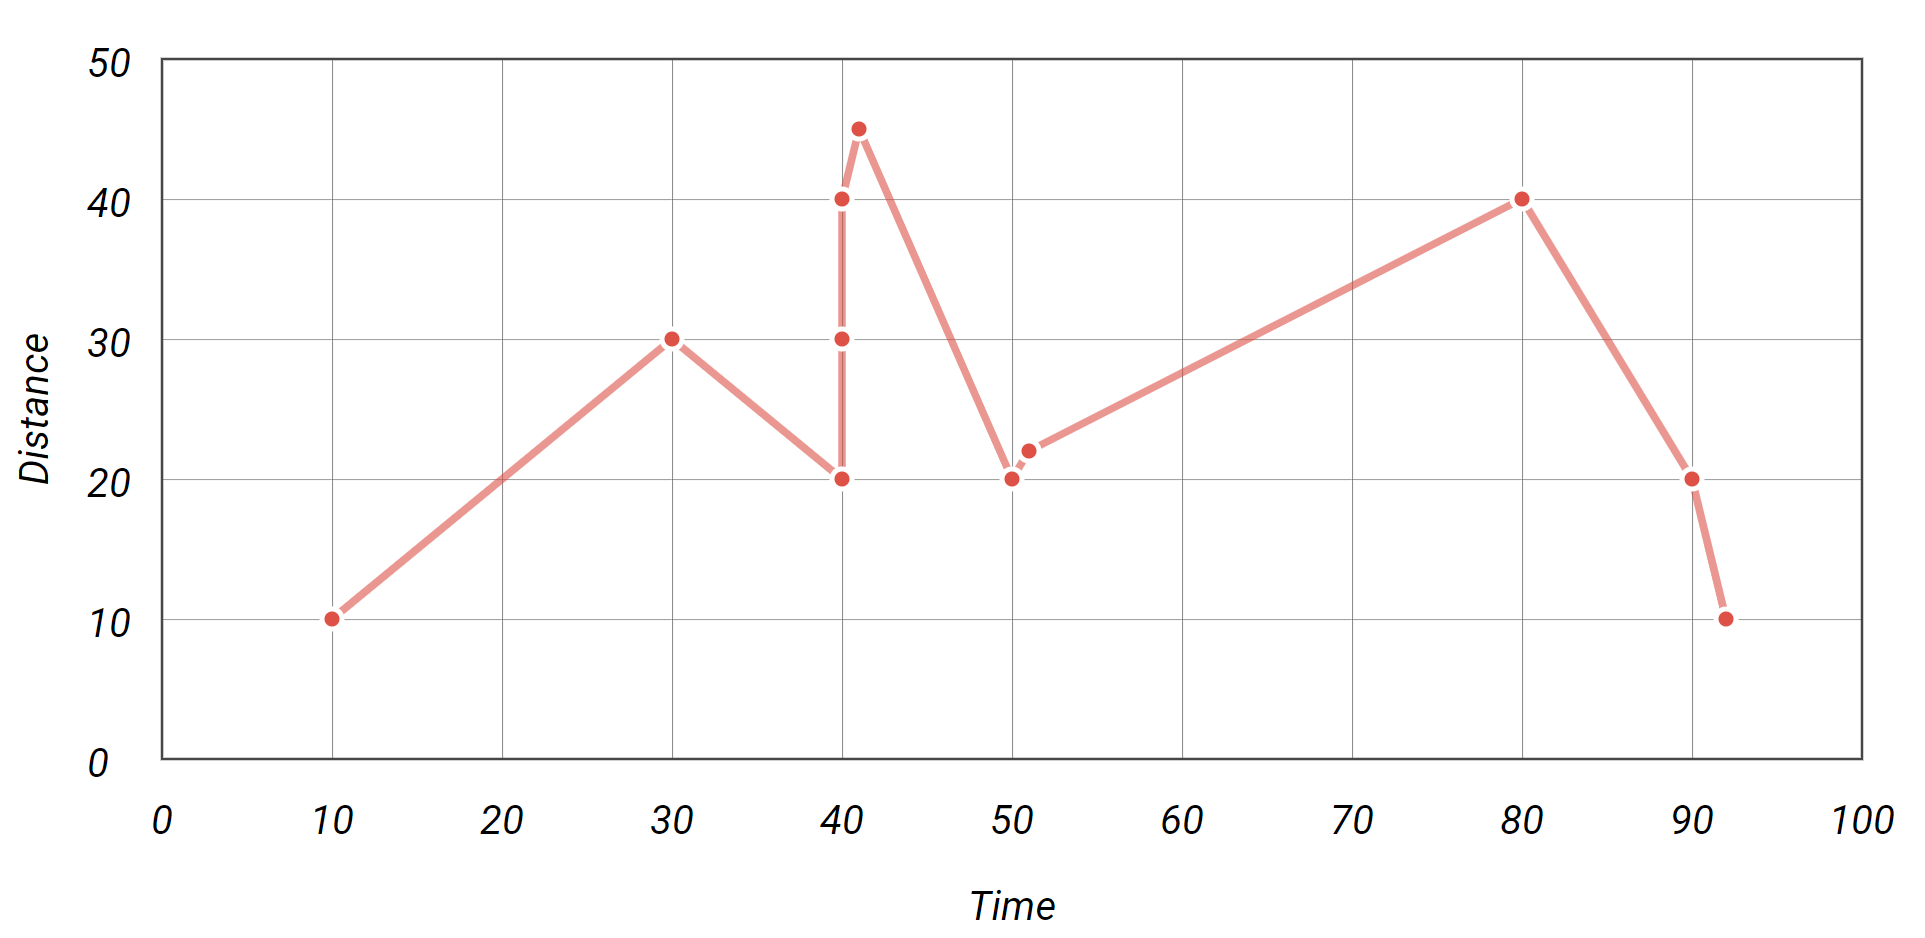
TypeScript:
lineData = [
    {x: 10, y: 10, info: ''},
    {x: 80, y: 40, info: ''},
    {x: 30, y: 30, info: ''},
    {x: 40, y: 20, info: ''},
    {x: 40, y: 30, info: ''},
    {x: 40, y: 40, info: ''},
    {x: 50, y: 20, info: ''},
    {x: 90, y: 20, info: ''},
    {x: 41, y: 45, info: ''},
    {x: 51, y: 22, info: ''},
    {x: 92, y: 10, info: ''}
  ];
HTML:
<ngx-line-graph
[width]="800" [height]="400"
[minX]="0" [maxX]="100"
[minY]="0" [maxY]="50"
[gridPrecisionX]="10"
[gridPrecisionY]="10"
xAxisTitle="Time"
yAxisTitle="Distance"
[data]="lineData"
color="#ff4444"></ngx-line-graph>
Multi Line Graph
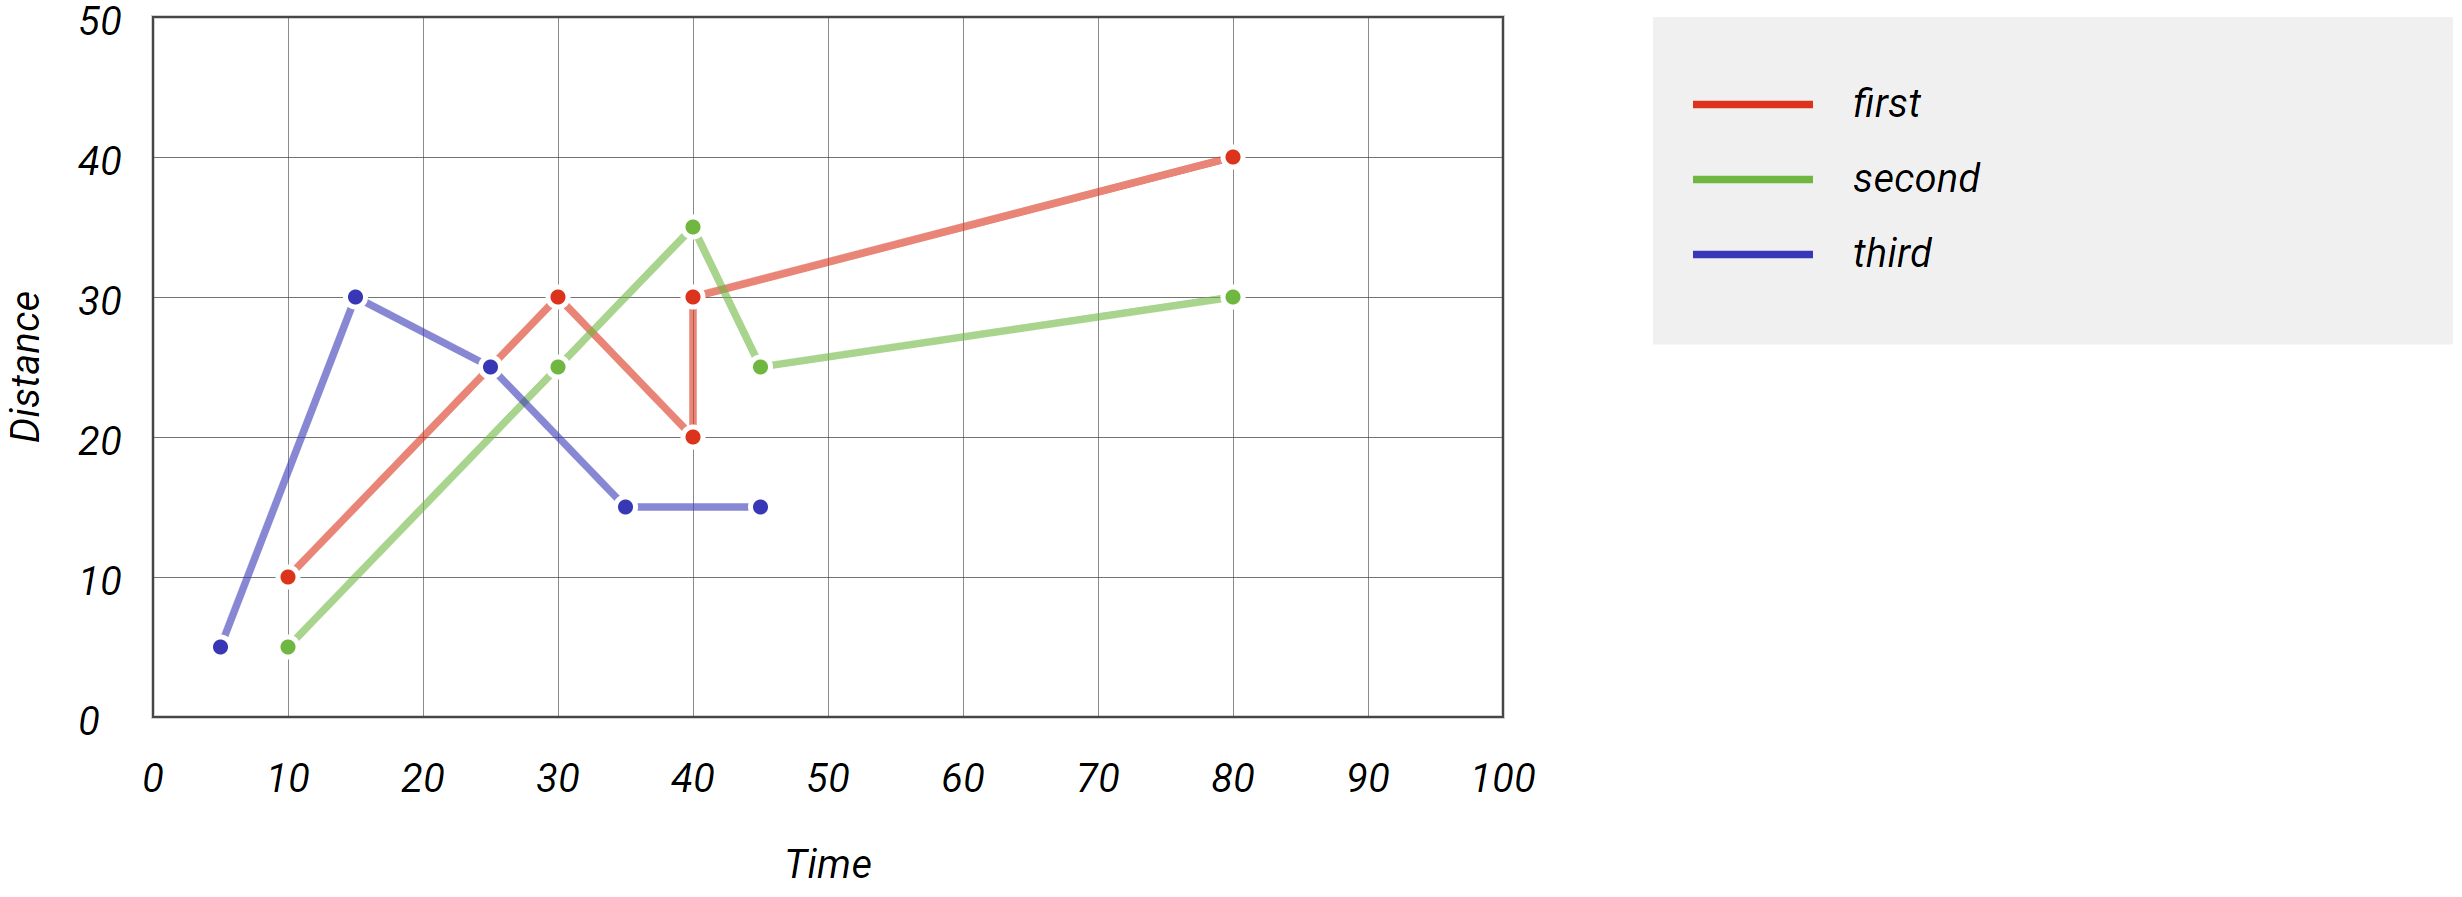
TypeScript:
multiLineData = [
    {name: 'first', color: '#ff1111', data: [
      {x: 10, y: 10, info: 'Point 1'},
      {x: 80, y: 40, info: 'Point 2'},
      {x: 30, y: 30, info: 'Point 3'},
      {x: 40, y: 20, info: 'Point 4'},
      {x: 40, y: 30, info: 'Point 5'}
    ]},
    {name: 'second', color: '#33bb33', data: [
      {x: 10, y: 5, info:  ''},
      {x: 80, y: 30, info: ''},
      {x: 30, y: 25, info: ''},
      {x: 40, y: 35, info: ''},
      {x: 45, y: 25, info: ''}
    ]},
    {name: 'third', color: '#3333bb', data: [
      {x: 5, y: 5, info: ''},
      {x: 15, y: 30, info: ''},
      {x: 25, y: 25, info: ''},
      {x: 35, y: 15, info: ''},
      {x: 45, y: 15, info: ''}
    ]}
  ];
HTML:
<ngx-multi-line-graph [width]="1100" [height]="400"
[minX]="0" [maxX]="100"
[minY]="0" [maxY]="50"
[gridPrecisionX]="10"
[gridPrecisionY]="10"
xAxisTitle="Time"
yAxisTitle="Distance"
[data]="multiLineData"></ngx-multi-line-graph>
Bar Chart
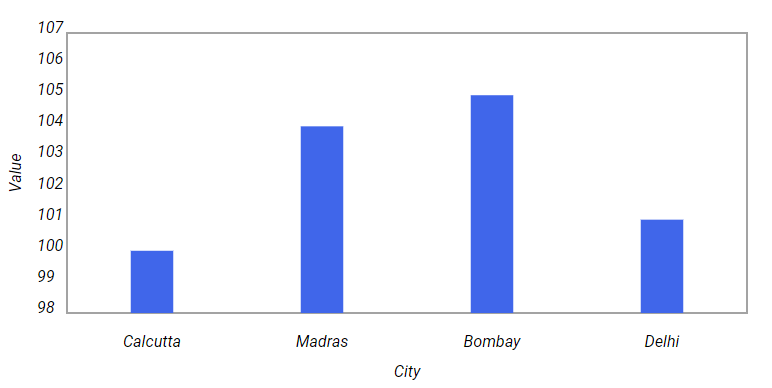
TypeScript:
barChartData = [
    {
      name: 'Calcutta',
      value: 1
    },
    {
      name: 'Madras',
      value: 3
    },
    {
      name: 'Bombay',
      value: 9
    },
    {
      name: 'Delhi',
      value: 8
    }
  ];
HTML:
<ngx-bar-chart [width]="1100" [height]="400"
xAxisTitle="City"
yAxisTitle="Value"
[data]="barChartData"
[showGridLines]="false"
color="#1166ee"></ngx-bar-chart>
Clustered Bar Chart
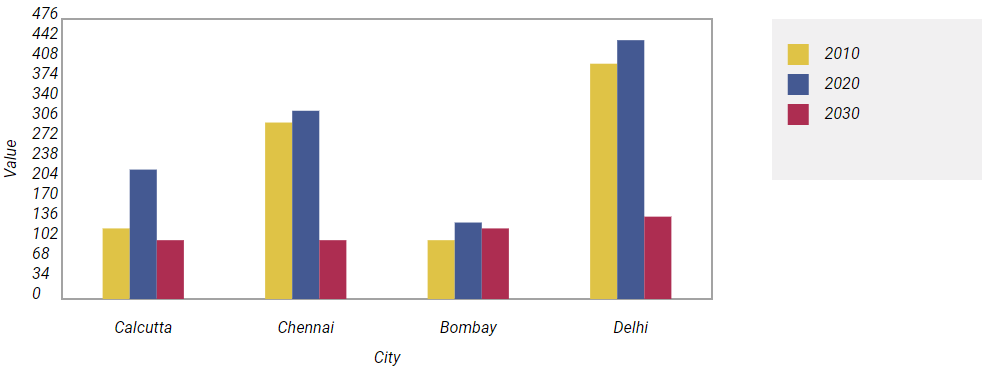
TypeScript:
clusteredBarChartData = [
    {
      series: '2010',
      color: '#EAC435',
      data: [
        {
          name: 'Calcutta',
          value: 120
        },
        {
          name: 'Chennai',
          value: 300
        },
        {
          name: 'Bombay',
          value: 100
        },
        {
          name: 'Delhi',
          value: 400
        }
      ]
    },
    {
      series: '2020',
      color: '#345995',
      data: [
        {
          name: 'Calcutta',
          value: 220
        },
        {
          name: 'Chennai',
          value: 320
        },
        {
          name: 'Bombay',
          value: 130
        },
        {
          name: 'Delhi',
          value: 440
        }
      ]
    },
    {
      series: '2030',
      color: '#CA1551',
      data: [
        {
          name: 'Calcutta',
          value: 100
        },
        {
          name: 'Chennai',
          value: 100
        },
        {
          name: 'Bombay',
          value: 120
        },
        {
          name: 'Delhi',
          value: 140
        }
      ]
    }
  ];
HTML:
<ngx-clustered-bar-chart [width]="1100" [height]="400"
xAxisTitle="City"
yAxisTitle="Value"
[data]="clusteredBarChartData"></ngx-clustered-bar-chart>
Pie Chart
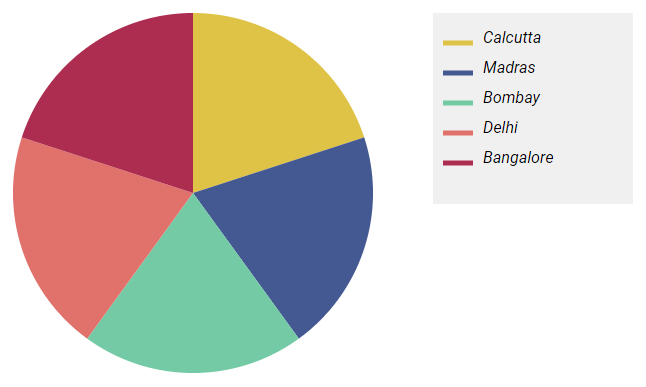
TypeScript:
pieChartData = [
    {
      name: 'Calcutta',
      color: '#EAC435',
      value: 50
    },
    {
      name: 'Madras',
      color: '#345995',
      value: 50
    },
    {
      name: 'Bombay',
      color: '#03CEA4',
      value: 50
    },
    {
      name: 'Delhi',
      color: '#FF6B6B',
      value: 50
    },
    {
      name: 'Bangalore',
      color: '#CA1551',
      value: 50
    }
  ];
HTML:
<ngx-pie-chart [width]="800"
[data]="pieChartData" colorScheme="colorful"></ngx-pie-chart>
Donut Chart
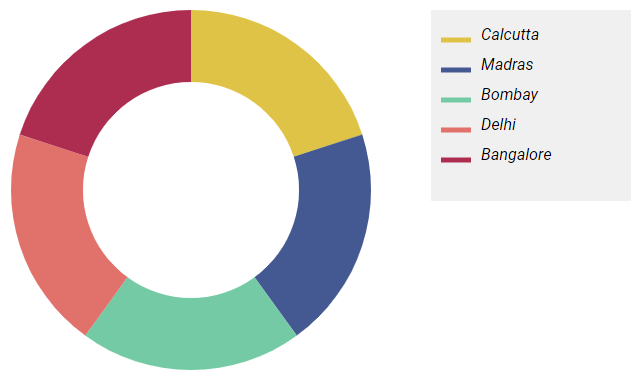
TypeScript:
donutChartData = [
    {
      name: 'Calcutta',
      color: '#EAC435',
      value: 50
    },
    {
      name: 'Madras',
      color: '#345995',
      value: 50
    },
    {
      name: 'Bombay',
      color: '#03CEA4',
      value: 50
    },
    {
      name: 'Delhi',
      color: '#FF6B6B',
      value: 50
    },
    {
      name: 'Bangalore',
      color: '#CA1551',
      value: 50
    }
  ];
HTML:
<ngx-donut-chart [width]="800"
[data]="donutChartData" colorScheme="colorful"></ngx-donut-chart>
Sunburst Chart
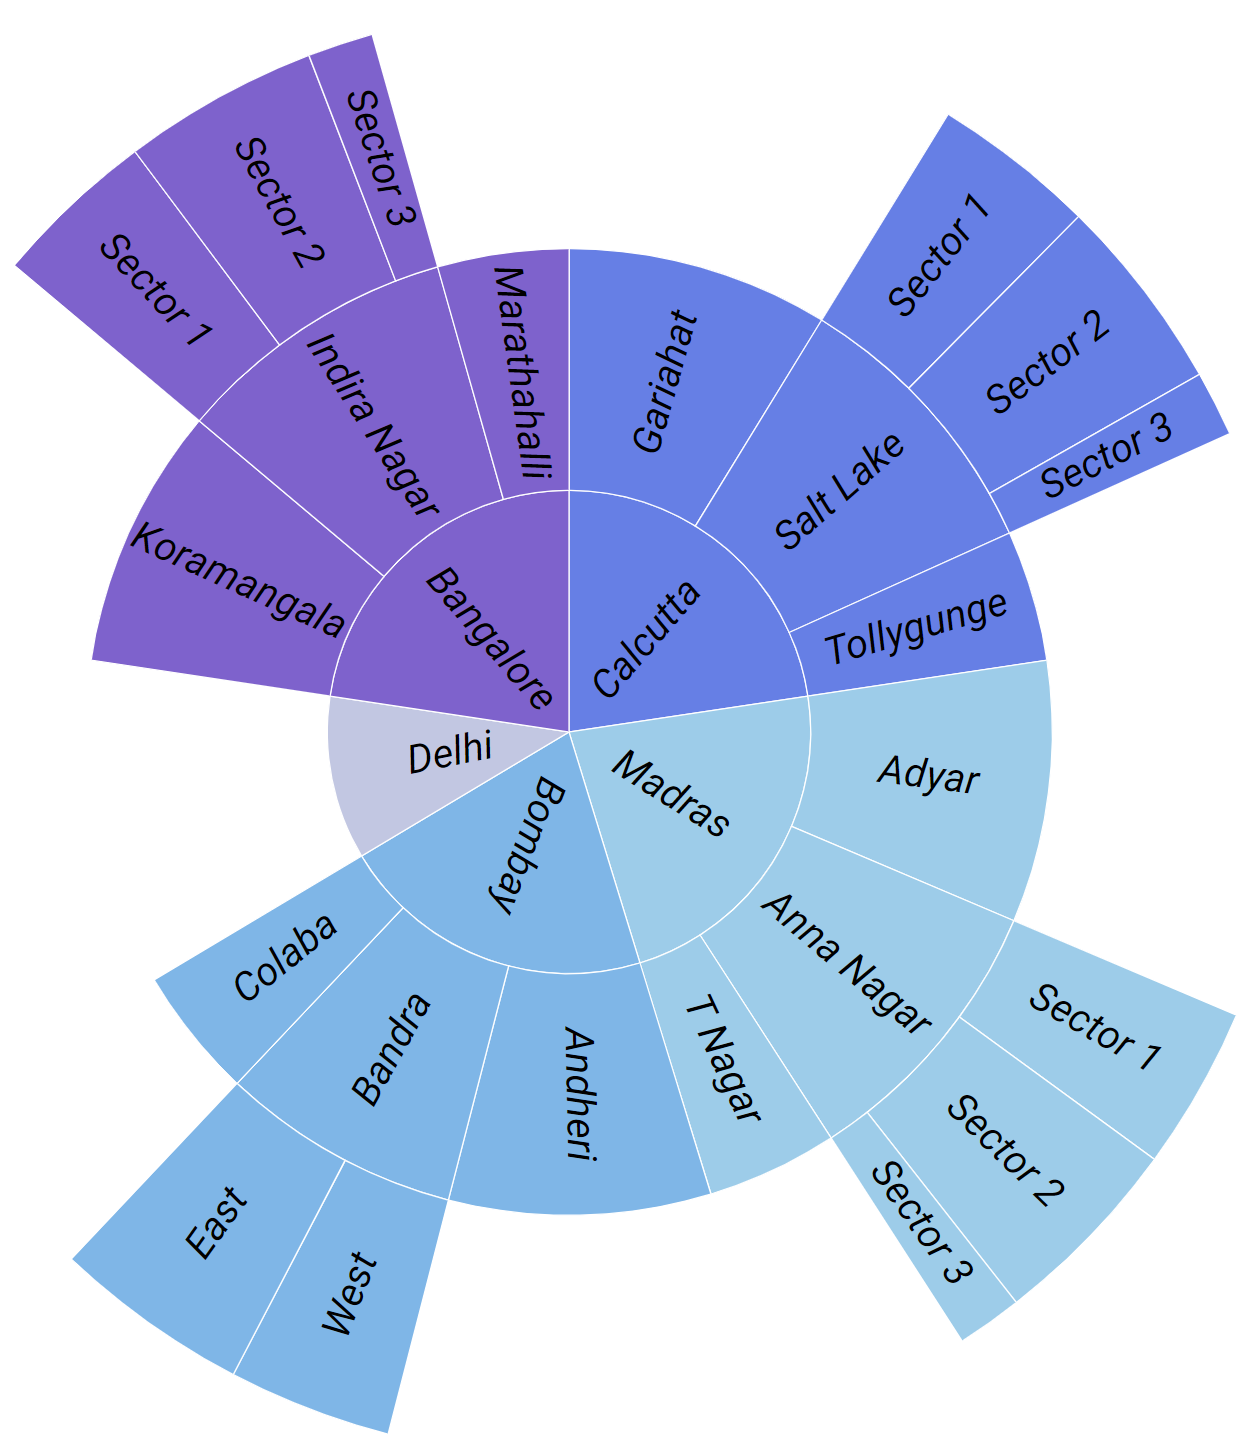
TypeScript:
sunburstChartData = [
    {
      name: 'Calcutta',
      children: [
        { name: 'Gariahat', value: 120 },
        { name: 'Salt Lake', children: [
          { name: 'Sector 1', value: 50 },
          { name: 'Sector 2', value: 60 },
          { name: 'Sector 3', value: 20 }
        ]},
        { name: 'Tollygunge', value: 60 }
      ]
    },
    {
      name: 'Madras',
      children: [
        { name: 'Adyar', value: 120 },
        { name: 'Anna Nagar', children: [
          { name: 'Sector 1', value: 50 },
          { name: 'Sector 2', value: 60 },
          { name: 'Sector 3', value: 20 }
        ]},
        { name: 'T Nagar', value: 60 }
      ]
    },
    {
      name: 'Bombay',
      children: [
        { name: 'Andheri', value: 120 },
        { name: 'Bandra', children: [
          { name: 'West', value: 50 },
          { name: 'East', value: 60 }
        ]},
        { name: 'Colaba', value: 60 }
      ]
    },
    {
      name: 'Delhi',
      value: 150
    },
    {
      name: 'Bangalore',
      children: [
        { name: 'Koramangala', value: 120 },
        { name: 'Indira Nagar', children: [
          { name: 'Sector 1', value: 50 },
          { name: 'Sector 2', value: 60 },
          { name: 'Sector 3', value: 20 }
        ]},
        { name: 'Marathahalli', value: 60 }
      ]
    }
  ];
HTML:
<ngx-sunburst-chart [width]="700"
[data]="sunburstChartData" colorScheme="cool"></ngx-sunburst-chart>
Gantt Chart
TypeScript:
ganttChartData = [
    {
      name: 'Market Team',
      timelines: {
        'Market Research': [
          {from: 'June 9, 2019', to: 'July 20, 2019', info: 'wtv'},
          {from: 'October 9, 2019', to: 'November 20, 2019', info: 'wtv'}
        ],
        'User Documentation': [
          {from: 'August 10, 2019', to: 'September 15, 2019', info: 'wtv'}
        ]
      }
    },
    {
      name: 'Development Team',
      timelines: {
        'Software Development': [
          {from: 'July 9, 2019', to: 'October 20, 2019', info: 'wtv'}
        ],
        'Testing': [
          {from: 'October 25, 2019', to: 'November 15, 2019', info: 'wtv'}
        ],
        'User Documentation': [
          {from: 'August 1, 2019', to: 'August 15, 2019', info: 'wtv'}
        ]
      }
    },
    {
      name: 'Test Team A',
      timelines: {
        'Testing': [
          {from: 'August 1, 2019', to: 'August 15, 2019', info: 'wtv'}
        ]
      }
    },
    {
      name: 'Test Team B',
      timelines: {
        'Testing': [
          {from: 'August 15, 2019', to: 'August 30, 2019', info: 'wtv'}
        ]
      }
    },
    {
      name: 'Sales Team',
      timelines: {
        'Pitching': [
          {from: 'July 9, 2019', to: 'October 20, 2019', info: 'wtv'}
        ],
        'Sales': [
          {from: 'October 25, 2019', to: 'November 15, 2019', info: 'wtv'}
        ]
      }
    },
    {
      name: 'Planning Team',
      timelines: {
        'Planning': [
          {from: 'May 9, 2019', to: 'May 30, 2019', info: 'wtv'}
        ]
      }
    }
  ];
HTML:
<ngx-gantt-chart [width]="1100"
[data]="ganttChartData" colorScheme="cool"></ngx-gantt-chart>
Timeline Chart
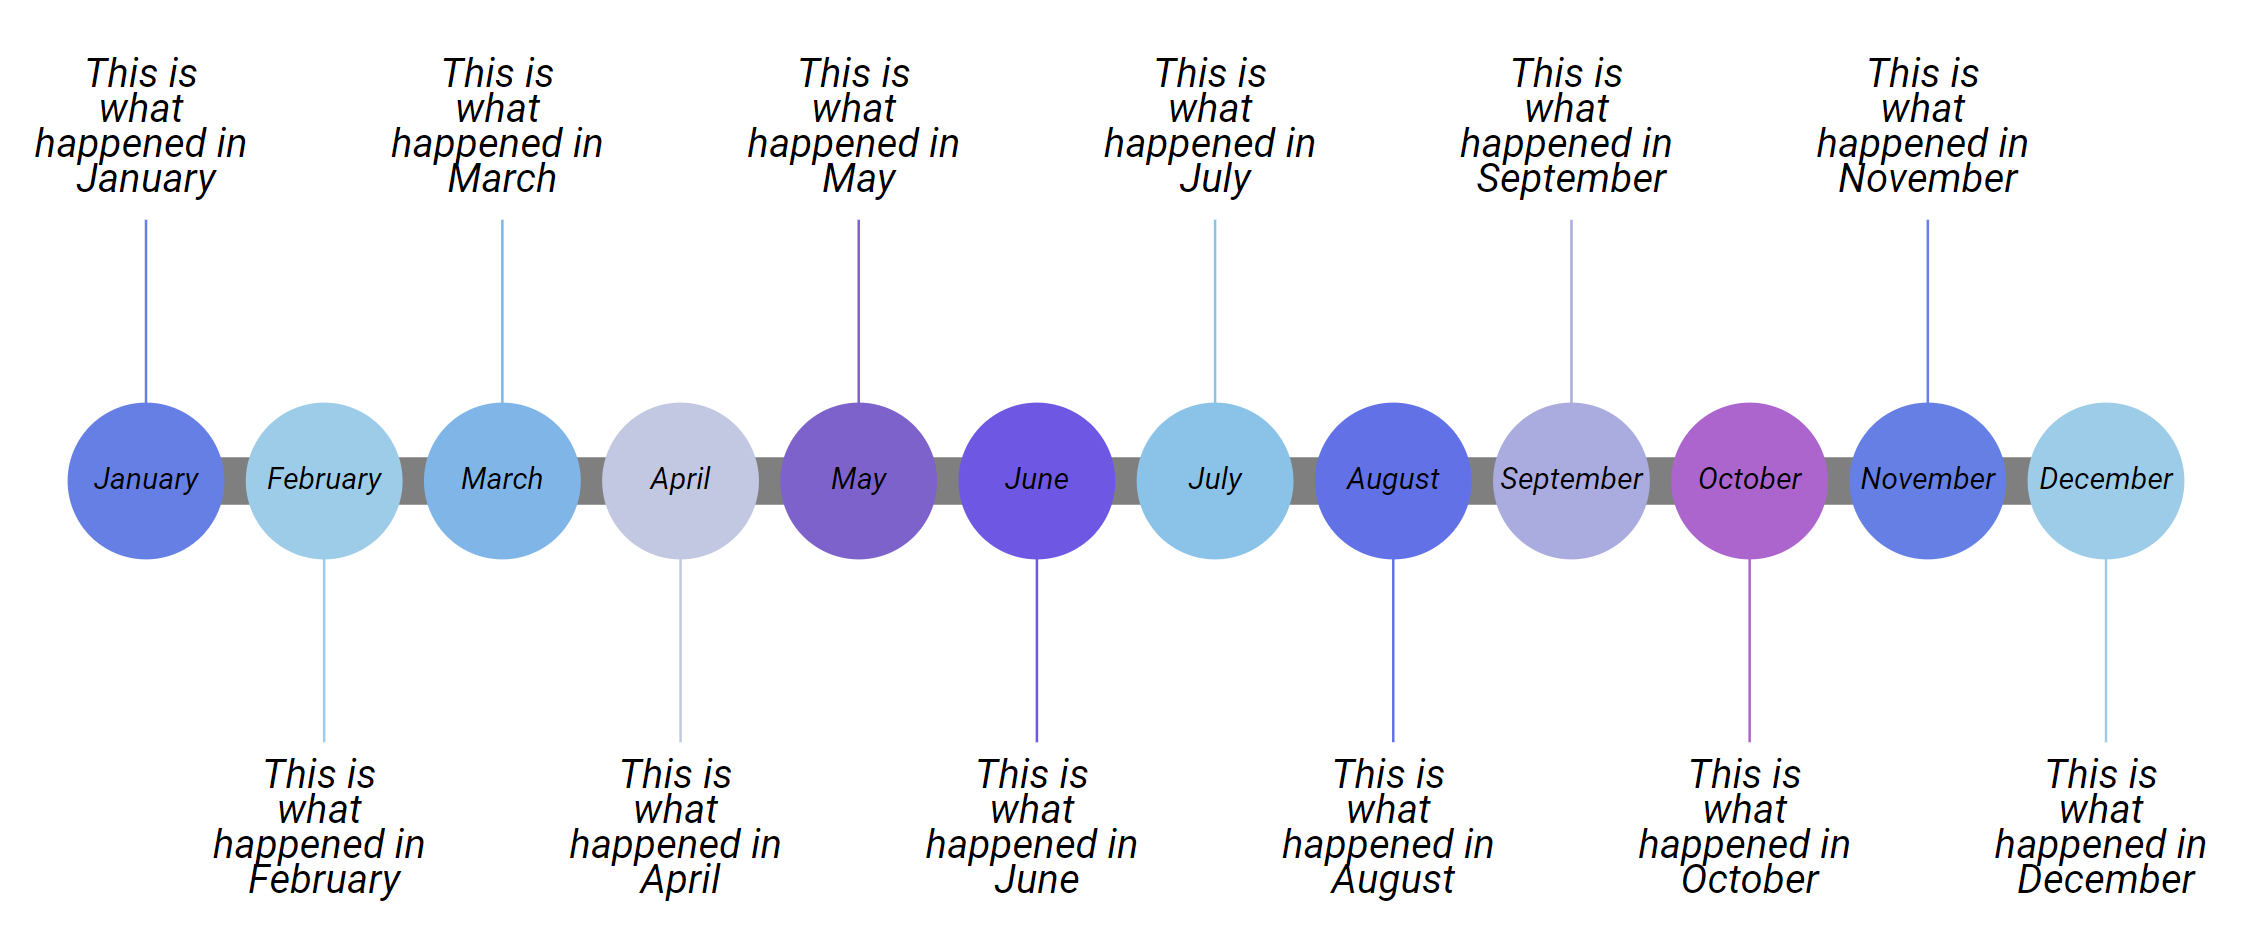
TypeScript:
timelineChartData = [
    { time: 1,
      displayTime: 'January',
      text: 'This is what happened in January'
    }, { time: 2,
      displayTime: 'February',
      text: 'This is what happened in February'
    }, { time: 3,
      displayTime: 'March',
      text: 'This is what happened in March'
    }, { time: 4,
      displayTime: 'April',
      text: 'This is what happened in April'
    }, { time: 5,
      displayTime: 'May',
      text: 'This is what happened in May'
    }, { time: 6,
      displayTime: 'June',
      text: 'This is what happened in June'
    }, { time: 7,
      displayTime: 'July',
      text: 'This is what happened in July'
    }, { time: 8,
      displayTime: 'August',
      text: 'This is what happened in August'
    }, { time: 9,
      displayTime: 'September',
      text: 'This is what happened in September'
    }, { time: 10,
      displayTime: 'October',
      text: 'This is what happened in October'
    }, { time: 11,
      displayTime: 'November',
      text: 'This is what happened in November'
    }, { time: 12,
      displayTime: 'December',
      text: 'This is what happened in December'
    }
  ];
HTML:
<ngx-timeline-chart [width]="1100" [height]="500"
[data]="timelineChartData" colorScheme="cool"></ngx-timeline-chart>