tskit-arg-visualizer 0.0.5
pip install tskit-arg-visualizer
Released:
Interactive visualization method for ancestral recombination graphs
Navigation

Unverified details
These details have not been verified by PyPIProject links
Meta
- License: MIT License
- Author: James Kitchens
- Tags population genetics, tree sequence, ancestral recombination graph, visualization, D3.js
- Requires: Python >=3.7
Classifiers
- Development Status
- Environment
- Intended Audience
- License
- Operating System
- Programming Language
- Topic
Project description
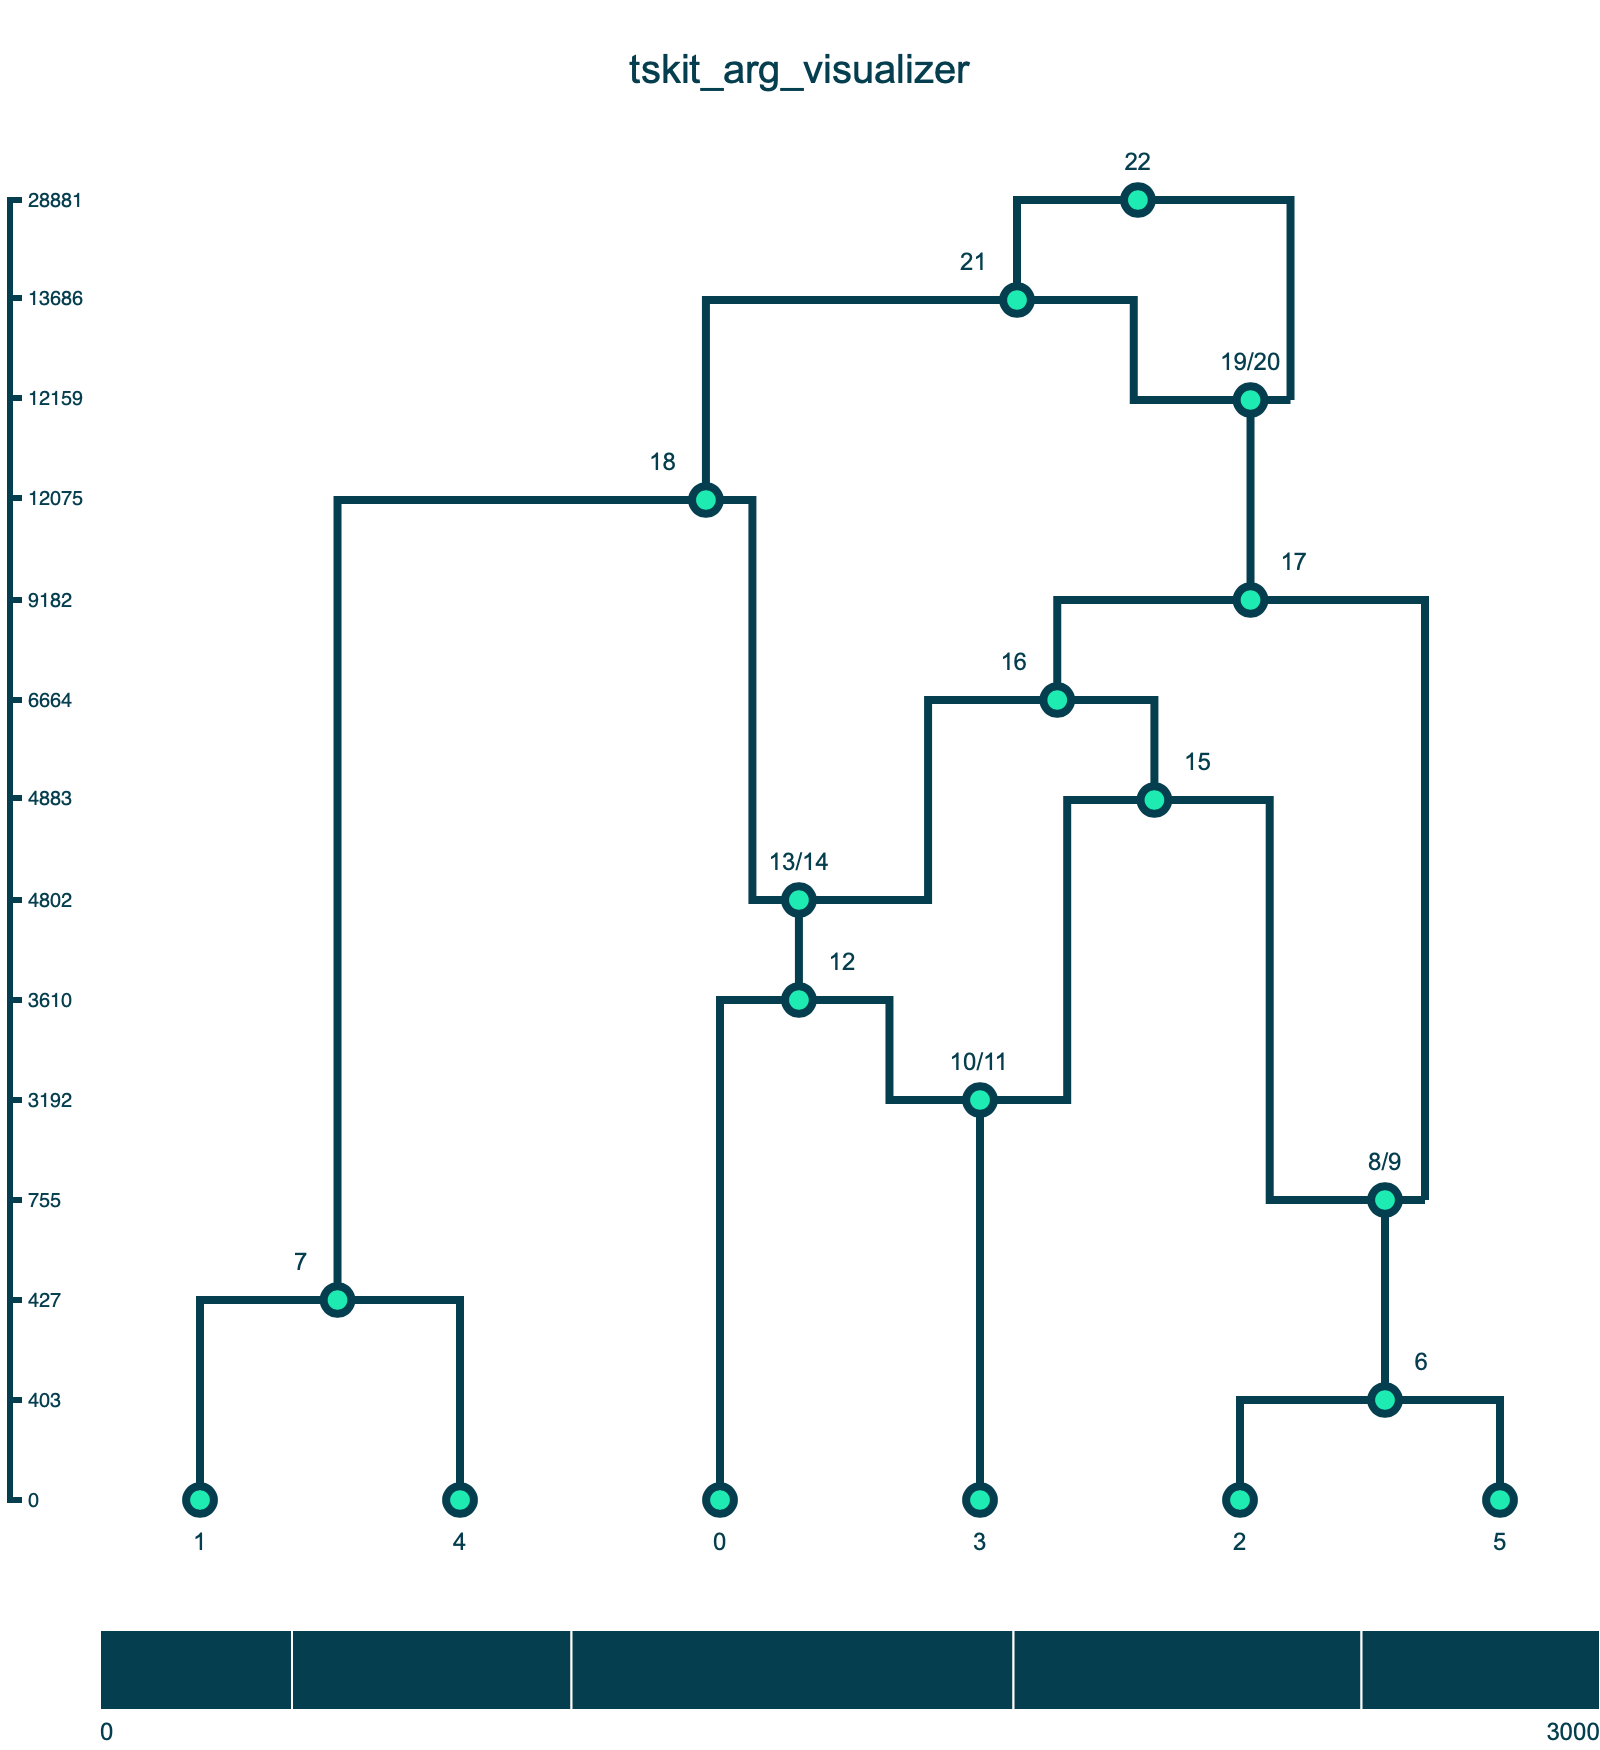
A method for drawing ancestral recombination graphs from tskit tree sequences in Python using D3.js. ARGs are plotted using a D3's force layout. All nodes have a fixed position on the y-axis set by fy. Sample nodes have a fixed position on the x-axis set by fx; the ordering of the sample nodes comes from the first tree in the tskit tree sequence (this is not always the optimal ordering but is generally a good starting point for plotting). The x positions of other nodes are set by a force simulation where all nodes repel each other countered by a linkage force between connected nodes in the graph.
Users can click and drag the nodes (including the sample) along the x-axis to further clean up the layout of the graph. The simulation does not take into account line crosses, which can often be improved with some fiddling. Once a node has been moved by a user, its position is fixed with regards to the force simulation.
See tutorial.md for a walkthrough of the package.
Project details
Unverified details
These details have not been verified by PyPIProject links
Meta
- License: MIT License
- Author: James Kitchens
- Tags population genetics, tree sequence, ancestral recombination graph, visualization, D3.js
- Requires: Python >=3.7
Classifiers
- Development Status
- Environment
- Intended Audience
- License
- Operating System
- Programming Language
- Topic


Download files
Download the file for your platform. If you're not sure which to choose, learn more about installing packages.
Source Distribution
Built Distribution
File details
Details for the file tskit_arg_visualizer-0.0.5.tar.gz.
File metadata
- Download URL: tskit_arg_visualizer-0.0.5.tar.gz
- Upload date:
- Size: 568.3 kB
- Tags: Source
- Uploaded using Trusted Publishing? No
- Uploaded via: twine/6.1.0 CPython/3.13.0
File hashes
| Algorithm | Hash digest | |
|---|---|---|
| SHA256 | 9ab7c0e4e15e86d3171864913347d36e42f96fead010e8ed5544720485b659e0 |
|
| MD5 | d5c51039c9df4a807c7e19529413c482 |
|
| BLAKE2b-256 | 742d0c577a7b9b948aecde2ee01f970f2300ad8700e22813dbaaf7691dc8d2fa |
File details
Details for the file tskit_arg_visualizer-0.0.5-py3-none-any.whl.
File metadata
- Download URL: tskit_arg_visualizer-0.0.5-py3-none-any.whl
- Upload date:
- Size: 33.5 kB
- Tags: Python 3
- Uploaded using Trusted Publishing? No
- Uploaded via: twine/6.1.0 CPython/3.13.0
File hashes
| Algorithm | Hash digest | |
|---|---|---|
| SHA256 | 57119c21f4e19c85608eb7d8cde89296bfbf079ee957f932b6c9221504f33de6 |
|
| MD5 | 746d19bf299f1f2b9056d3812e9092a2 |
|
| BLAKE2b-256 | 183e5e22e962dd5dc016baadbb02b0fbe858c4e51652c0651898e4097d68340f |


