Package for automated signal segmentation, trend classification and analysis.

Project description
Trend classifier


Library for automated signal segmentation, trend classification and analysis.
Installation
-
The package is pip-installable. To install it, run:
pip3 install trend-classifier
Usage
Pandas DataFrame Input
usage:
import yfinance as yf
from trend_classifier import Segmenter

# download data from yahoo finance
df = yf.download("AAPL", start="2018-09-15", end="2022-09-05", interval="1d", progress=False)

x_in = list(range(0, len(df.index.tolist()), 1))
y_in = df["Adj Close"].tolist()

seg = Segmenter(x_in, y_in, n=20)
seg.calculate_segments()
For graphical output use Segmenter.plot_segments():
seg.plot_segments()
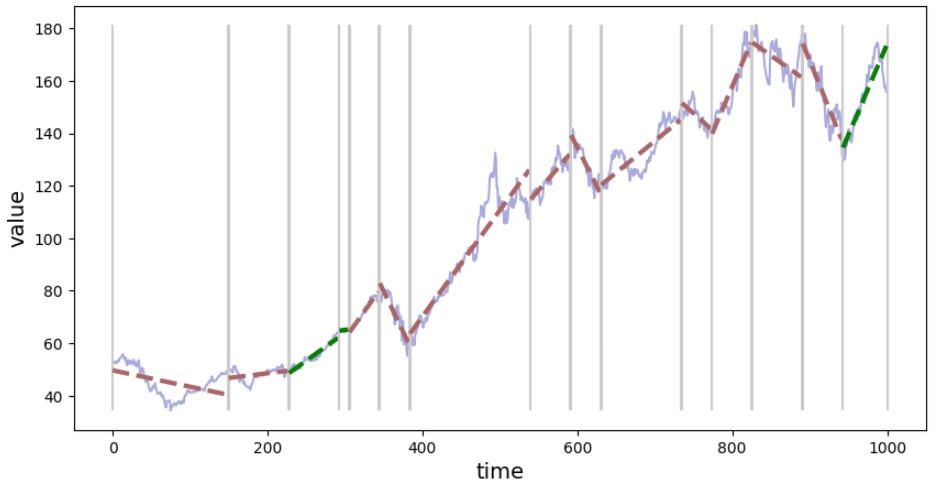
After calling method Segmenter.calculate_segments() segments are identified and information is stored in Segmenter.segments as list of Segment objects. Each Segment object. Each Segment object has attributes such as 'start', 'stop' - range of indices for the extracted segment, slope and many more attributes that might be helpful for further analysis.
Exemplary info on one segment:
from devtools import debug
debug(seg.segments[3])
and you should see something like this:
    seg.segments[3]: Segment(
        start=154,
        stop=177,
        slope=-0.37934038908585044,
        offset=109.54630934894907,
        slopes=[
            -0.45173184100846725,
            -0.22564684358754555,
            0.15555037018051593,
            0.34801127785130714,
        ],
        offsets=[
            121.65628807526804,
            83.56079272220015,
            17.32660986821478,
            -17.86417581658647,
        ],
        slopes_std=0.31334199799377654,
        offsets_std=54.60900279722876,
        std=0.933497081795997,
        span=82.0,
        reason_for_new_segment='offset',
    )
export results to tabular format (pandas DataFrame):
seg.segments.to_dataframe()

(NOTE: for clarity reasons, not all columns are shown in the screenshot above)
Alternative approach
- Smooth out the price data using the Savitzky-Golay filter,
- label the highs and lows.
- higher highs and higher lows indicates an uptrend.
The requirement here is than you need OHLC data for the assets you would like to analyse.
License
Release history Release notifications | RSS feed


Download files
Download the file for your platform. If you're not sure which to choose, learn more about installing packages.
Source Distribution
Built Distribution
Hashes for trend_classifier-0.1.10-py3-none-any.whl
| Algorithm | Hash digest | |
|---|---|---|
| SHA256 | abf413602e7731f51ed3388f56d5780c17b89a73e124b1c00785584bc0605b41 |
|
| MD5 | 53d38b07f60eef0b9511be015336a287 |
|
| BLAKE2b-256 | edffe7f2af95e80bd789679b236653a51c33dc7f30aa626f5d43aecdbe19b9ea |


