Enhance your matplotlib plots with publication-quality style

Project description

texplot is a python package to enhance matplotlib plots with publication-quality style.
Links
Install
This package requires \(\LaTeX\) to be installed. Ensure that the latex executable is available on your system’s PATH.
Install with pip

pip install texplot
Install with conda

conda install s-ameli::texplot
Set Theme
texplot can set theme either globally or locally:
Set Theme Globally
Call texplot.set_theme function to set the texplot theme globally in your script:
>>> import matplotlib.pyplot as plt
>>> import texplot
>>> texplot.set_theme()

>>> # Plot an example function
>>> fig, ax = plt.subplots()
>>> texplot.examples.plot_function(ax)
>>> plt.show()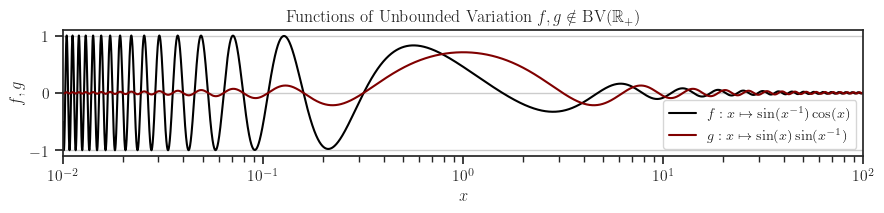
The theme set as described above will affect your entire Python script for its duration. However, you can revert to the default matplotlib theme at any time by calling the texplot.reset_theme function as shown below:
>>> # Resetting to default matplotlib theme
>>> texplot.reset_theme()

>>> # Plot another example function
>>> fig2, ax2 = plt.subplots()
>>> texplot.examples.plot_function(ax2)
>>> plt.show()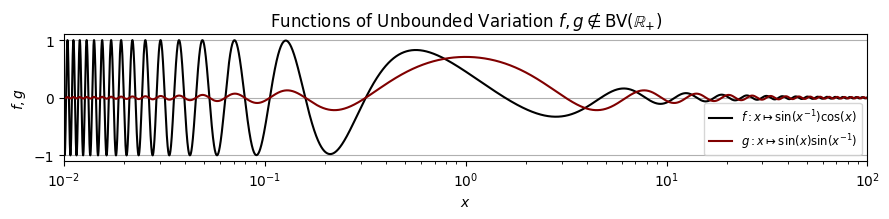
Set Theme Within a Local Scope
The texplot.theme function acts as a context manager, allowing you to apply the texplot theme within a specific local scope or function. The example below demonstrates setting the theme in a local scope. Outside of this scope, the default matplotlib theme remains unchanged.
>>> import matplotlib.pyplot as plt
>>> import texplot

>>> with texplot.theme():
>>>     fig, ax = plt.subplots()
>>>     texplot.examples.plot_function(ax)
>>>     plt.show()
Similarly, you can use the context manager with a function. In the example below, the texplot theme is applied only within the plot() function. Outside this function, the default matplotlib theme remains unchanged.
>>> import matplotlib.pyplot as plt
>>> import texplot

>>> @texplot.theme()
>>> def plot():
>>>     fig, ax = plt.subplots()
>>>     texplot.examples.plot_function(ax)
>>>     plt.show()

>>> plot()
Theme Options
You can customize the theme by passing arguments to either the texplot.set_theme or texplot.theme functions. The parameters for both functions are identical and detailed in the API reference. The available arguments are as follows:
Argument |
Value |
Description |
|---|---|---|
context |
'paper', 'notebook' (default), 'talk', or 'poster' |
Adjusts font size and scales of the plot depending on the context. |
style |
Sets matplotlib style |
|
font_scale |
float (default is 1) |
Scales the fonts. |
use_latex |
boolean (default is True) |
If True, the mathematical symbols are rendered with \(\LaTeX\). |
rc |
dictionary (default is {}) |
Passes any additional matplotlib’s rcParam dictionary. |
In the example below, we configure a dark background style, increase the font size by a factor of 1.2, and set the font family to sans-serif:
>>> import matplotlib.pyplot as plt
>>> import texplot

>>> with texplot.theme(
...         rc={'font.family': 'sans-serif'},
...         style='dark_background',
...         font_scale=1.2):
>>>
>>>     # Plot an example diagram
>>>     fig, ax = plt.subplots()
>>>     texplot.examples.plot_bifurcation_diagram(ax)
>>>     plt.show()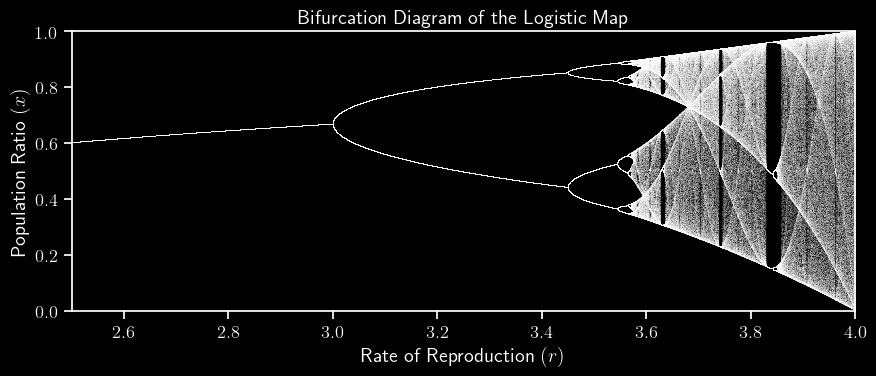
Show and Save Plots
When working on a machine without display graphics, such as a remote server that lacks X11, displaying plots is not possible. Instead, plots should be saved. The texplot.save_plot function provides a simple wrapper around matplotlib.pyplot.savefig to facilitate this. Additionally, the texplot.show_or_save_plot function attempts to display plots initially. If no graphical backend is available, it saves the plot instead. Additionally, you can configure it to both show and save the plot. Here is an example:
>>> import matplotlib.pyplot as plt
>>> import texplot

>>> with texplot.theme(rc={'font.family': 'sans-serif'}):
>>>
>>>     # Plot an example function
>>>     fig, ax = plt.subplots()
>>>     texplot.examples.lorenz(ax)
>>>
>>>     # Show and save plot
>>>     texplot.show_or_save_plot(plt, default_filename='lorenz.pdf',
...                               transparent_background=True, dpi=200,
...                               show_and_save=True, verbose=True)
plot saved to '/home/user/lorenz.pdf'.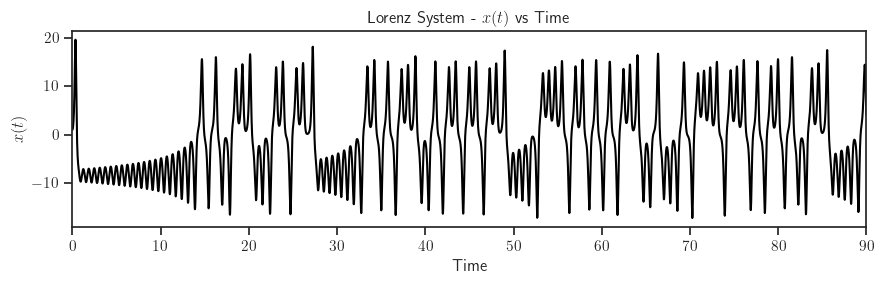
Test Package


To test the package, first clone the source code from the repository and install the required test packages by:
git clone https://github.com/ameli/texplot.git
cd texplot
python -m pip install -r tests/requirements.txt
python -m pip install .
Then, test with pytest:
pytestHow to Contribute
We welcome contributions via GitHub’s pull request. If you do not feel comfortable modifying the code, we also welcome feature requests and bug reports as GitHub issues.
License


Download files
Download the file for your platform. If you're not sure which to choose, learn more about installing packages.


