A simple and efficient Python implementation of Mapper algorithm for Topological Data Analysis
Verified details
These details have been verified by PyPIProject links
GitHub Statistics
Maintainers

Project description


tda-mapper
tda-mapper is a Python library based on the Mapper algorithm, a key tool in Topological Data Analysis (TDA). Designed for efficient computations and backed by advanced spatial search techniques, it scales seamlessly to high dimensional data, making it suitable for applications in machine learning, data mining, and exploratory data analysis.
Further details in the documentation and in the preprint.
Main Features
-
Fast Mapper graph construction: Accelerates computations with efficient spatial search, enabling analysis of large, high-dimensional datasets.
-
Scikit-learn compatibility: Easily integrate Mapper as a part of your machine learning workflows.
-
Flexible visualization options: Visualize Mapper graphs with multiple supported backends, tailored to your needs.
-
Interactive exploration: Explore data interactively through a user-friendly app.
Background
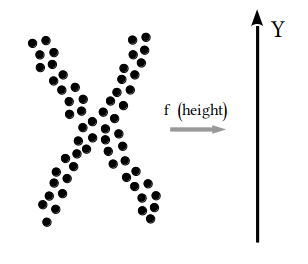
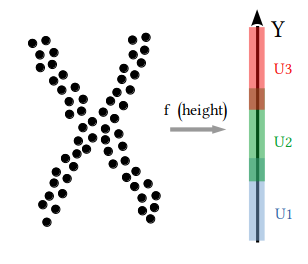
The Mapper algorithm transforms complex datasets into graph representations that highlight clusters, transitions, and topological features. These insights reveal hidden patterns in data, applicable across fields like social sciences, biology, and machine learning. For an in-depth coverage of Mapper, including its mathematical foundations and applications, read the the original paper.
| Step 1 | Step 2 | Step 3 | Step 4 |
|---|---|---|---|
 |
 |
 |
 |
| Choose lens | Cover image | Run clustering | Build graph |
Citations
If you use tda-mapper in your work, please consider citing both the library, archived in a permanent Zenodo record, and the preprint, which provides a broader methodological overview. We recommend citing the specific version of the library used in your research, as well as the latest version of the preprint. For citation examples, refer to the documentation.
Quick Start
Installation
To install the latest version uploaded on PyPI
pip install tda-mapper
How to Use
Here's a minimal example using the circles dataset from scikit-learn to
demonstrate how to use tda-mapper:
import numpy as np

from sklearn.datasets import make_circles
from sklearn.decomposition import PCA
from sklearn.cluster import DBSCAN

from tdamapper.learn import MapperAlgorithm
from tdamapper.cover import CubicalCover
from tdamapper.plot import MapperPlot

# load a labelled dataset
X, labels = make_circles(n_samples=5000, noise=0.05, factor=0.3, random_state=42)
y = PCA(2, random_state=42).fit_transform(X)

cover = CubicalCover(n_intervals=10, overlap_frac=0.3)
clust = DBSCAN()
graph = MapperAlgorithm(cover, clust).fit_transform(X, y)

# color according to labels
fig = MapperPlot(graph, dim=2, seed=42, iterations=60).plot_plotly(colors=labels)
fig.show(config={'scrollZoom': True})
| Original Dataset | Mapper Graph |
|---|---|
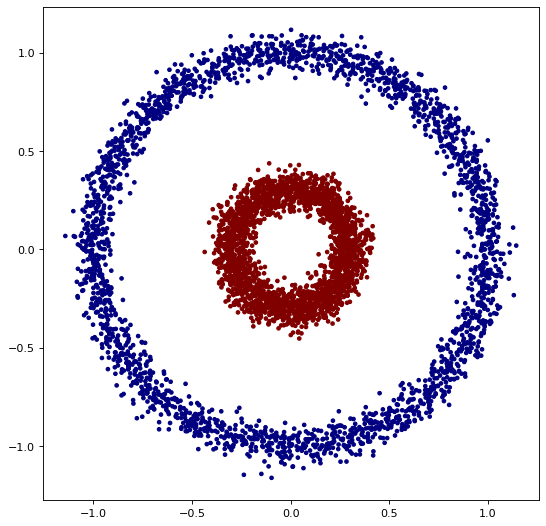 |
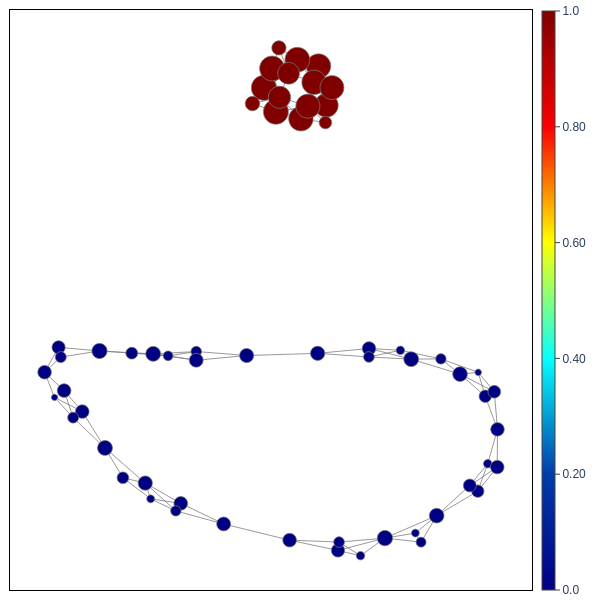 |
More examples can be found in the documentation.
Interactive App
Use our Streamlit app to visualize and explore your data without writing code. You can run a live demo directly on Streamlit Cloud, or locally on your machine using the following:
pip install -r app/requirements.txt
streamlit run app/streamlit_app.py


