Python package for drawing graphs for presentation materials with matplotlib.

Project description
rei-preso-plot


Python package for drawing graphs for presentation materials with matplotlib.
Description
A package for creating graphs suitable for presentation materials with matplotlib.
The created graph can be directly placed on a presentation slide with a nice design.
Requirement
- Python 3.11.1
- matplotlib 3.6.3
Installation
pip install rei-preso-plot
Usage
Using graph functions
Graph functions.
Can emphasize parts by adding color or embedding legends in line graphs.
When passing matplotlib.axes.Axes to the argument ax, it returns the matplotlib.axes.Axes. Therefore, using the functions of matplotlib, you can specify the drawing range, etc., after these functions.
| Function | Description |
|---|---|
reipresoplot.plot_line_graph |
Line graph drawing function |
reipresoplot.plot_bar_graph |
Bar graph drawing function |
| Code | Graph |
|---|---|
| for_line_graph.py | 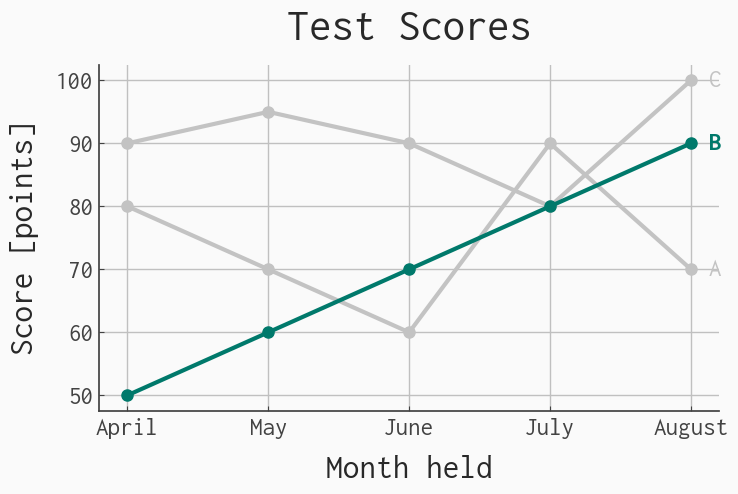 |
| for_bar_graph.py | 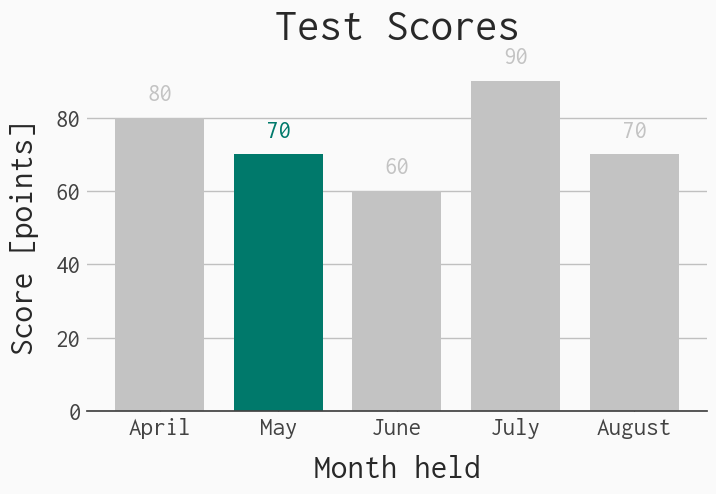 |
Using matplotlibrc files
By reading matplotlibrc files, you can customize the matplotlib style as a whole, i.e. without specifying it with rcParams, etc.
For details, see Matplotlib documentation.
| Function | Description |
|---|---|
reipresoplot.use_line_graph_style_as_global_settings |
Use matplotlibrc file for line graphs as global settings |
reipresoplot.use_bar_graph_style_as_global_settings |
Use matplotlibrc file for bar graphs as global settings |
reipresoplot.get_line_graph_mpl_style_path |
Get the path to the matplotlibrc file for line graphs |
reipresoplot.get_bar_graph_mpl_style_path |
Get the path to the matplotlibrc file for bar graphs |
If you want to apply the style globally to the entire graph plot, use reipresoplot.use_XXX_graph_style_as_global_settings.
from matplotlib import pyplot as plt
from reipresoplot import use_line_graph_style_as_global_settings

use_line_graph_style_as_global_settings()

plt.plot(x, y)
plt.show()
If you want to use it temporarily, use a context manager.
from reipresoplot import get_line_graph_mpl_style_path

mpl_style_path: str = get_line_graph_mpl_style_path()
with plt.style.context(mpl_style_path):
    plt.plot(x, y)
    plt.show()
Line graph changes
Please refer to the code at examples/using_matplotlibrc_files/for_line_graph.py for line graph changes.
| Before | After |
|---|---|
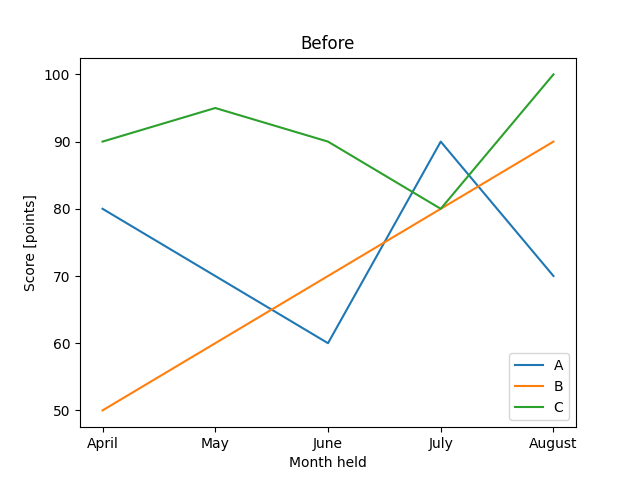 |
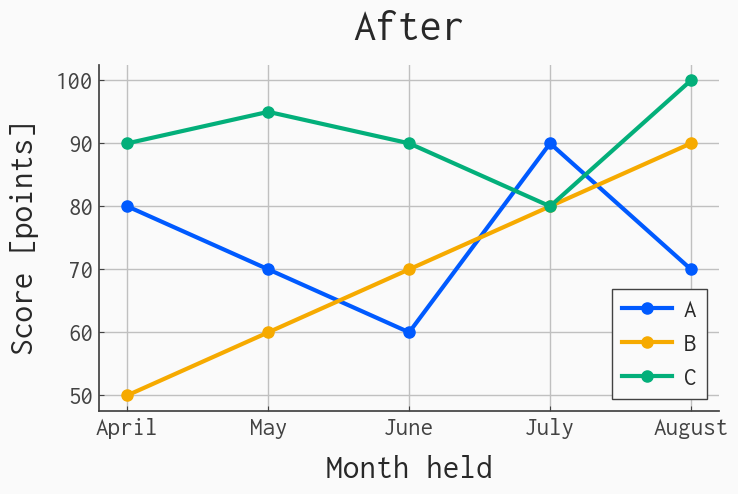 |
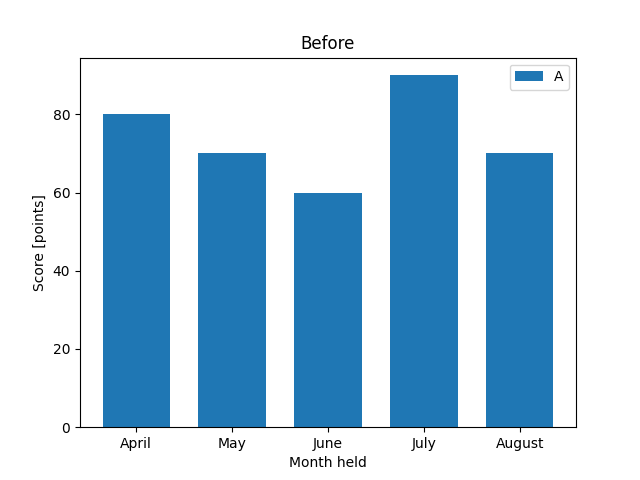
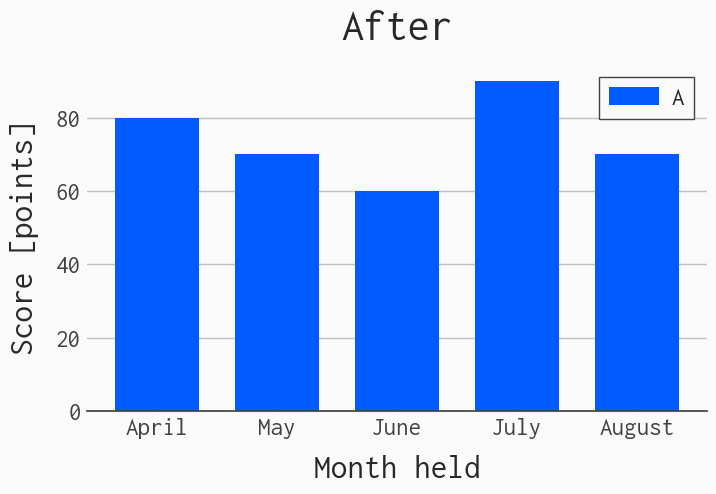
Bar graph changes
Please refer to the code at examples/using_matplotlibrc_files/for_bar_graph.py for bar graph changes.
| Before | After |
|---|---|
 |
 |
Test
You can test graph drawing with Pytest.
pytest
Author
License
© 2023 NakuRei
This software is released under the MIT License, see LICENSE.
Release history Release notifications | RSS feed


Download files
Download the file for your platform. If you're not sure which to choose, learn more about installing packages.
Source Distribution
Built Distribution
Hashes for rei_preso_plot-0.1.0-py3-none-any.whl
| Algorithm | Hash digest | |
|---|---|---|
| SHA256 | b74a73725143b219c3661e9c24a387f064c68ef7d1d891f39bc3a45144ff79cb |
|
| MD5 | 869f474366fdb066b9adec7f0c102704 |
|
| BLAKE2b-256 | 809e05b2e2f497761fdf49c6407fb5f791b7d5f1d7e5282d96a3e6be537beef4 |


