Python bindings for viewercloud

Project description
pyviewercloud
pyviewercloud are the bindings to use viewercloud directly in python.
Viewercloud is a library and also a cli to read and display Pointcloud.
It was initially used to display KITTI pointcloud.
However it was also tested on the Lyft Level 5 Dataset pointcloud.
It will also be able to display the 3D annotations and the 3D BoundingBox computed by your favorite algorithm.
Viewercloud will open a openGL window to display the pointcloud. Press qto close.
It can also take a screen shot of the current view to save as png. Press s take screenshot.
Python Usage
You can install pyviewercloud the python bindings to viewercloud thanks to Pyo3 and Pyo3-numpy
poetry add pyviewercloud
pip install pyviewercloud
import numpy as np
import pyviewercloud as pyviewer
# Create a new viewer with a window size 1200x1800.
viewer = pyviewer.PointcloudViewer(1200, 1800, 15000)
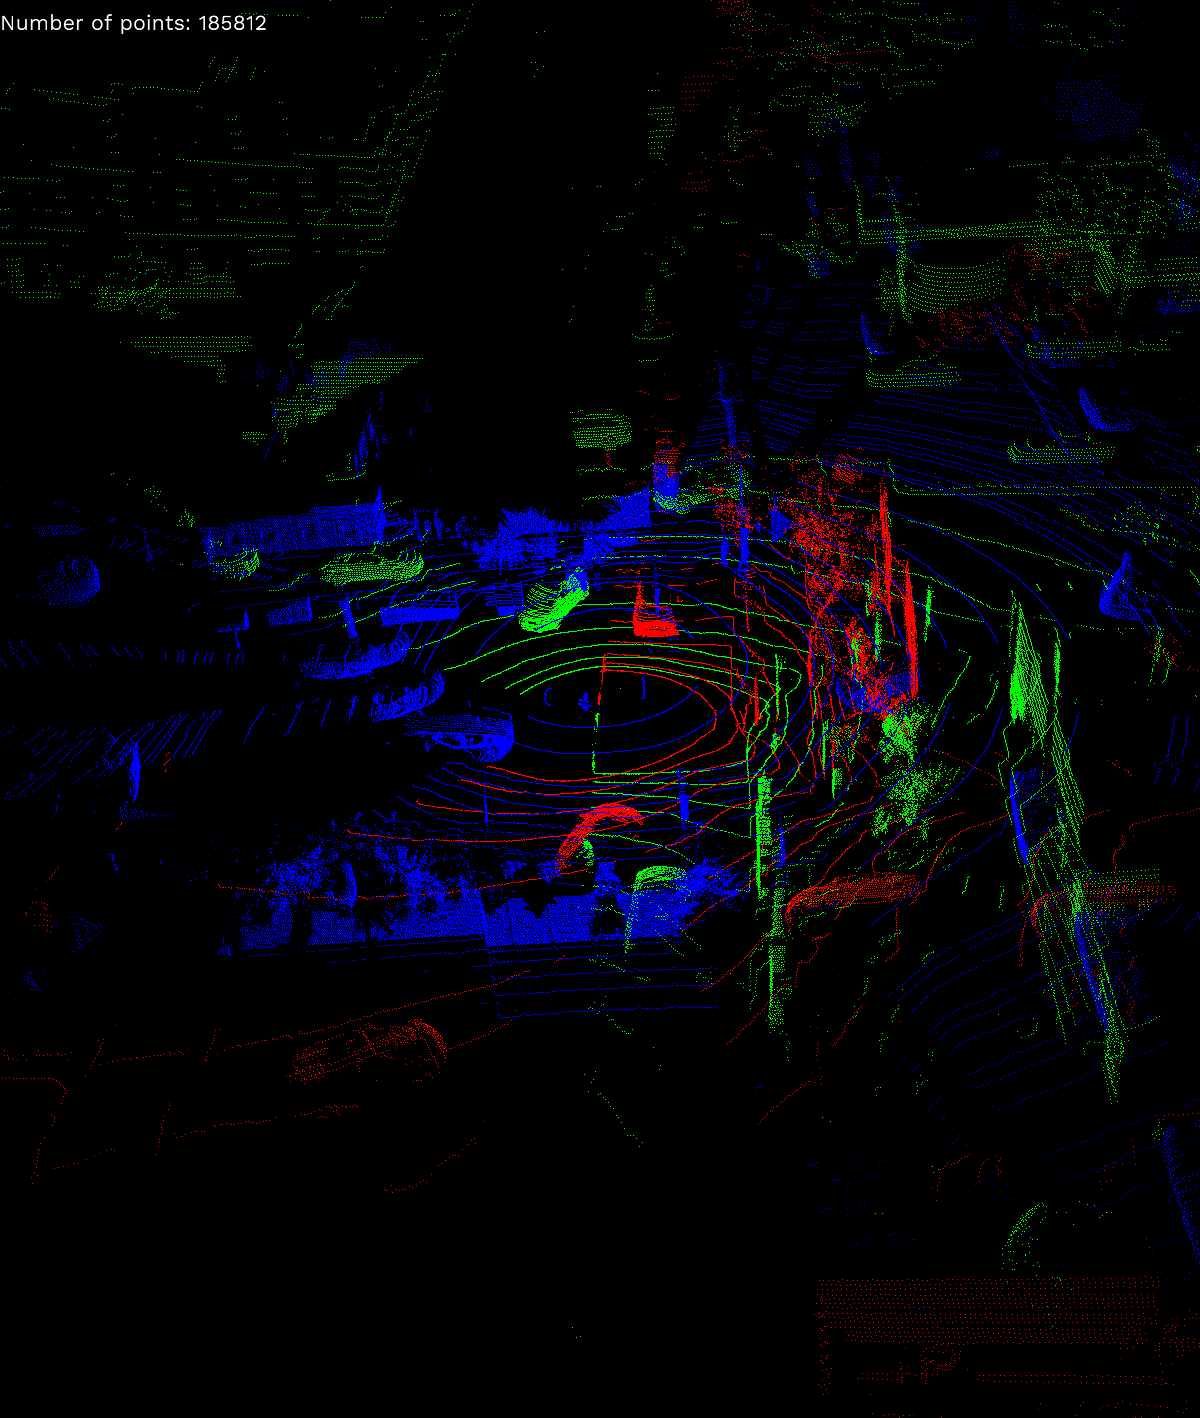
# Load some pointcloud from the lyft perception dataset
# Currently only support pointcloud as numpy.ndarray Nx3 in np.float32
lyft_point_cloud_1 = np.fromfile("tests/data/lyft/host-a101_lidar0_1241893239502712366.bin", dtype=np.float32).reshape((-1, 5))[:,:3]
lyft_point_cloud_2= np.fromfile("tests/data/lyft/host-a101_lidar1_1241893239502712366.bin", dtype=np.float32).reshape((-1, 5))[:,:3]
lyft_point_cloud_3= np.fromfile("tests/data/lyft/host-a101_lidar2_1241893239502712366.bin", dtype=np.float32).reshape((-1, 5))[:,:3]
# Add them one by one to the viewer to have different color
viewer.add_pointcloud(lyft_point_cloud_1, [255, 0, 0])
viewer.add_pointcloud(lyft_point_cloud_2, [0, 0, 255])
viewer.add_pointcloud(lyft_point_cloud_3, [0, 255, 0])
# You can now display the window
viewer.show()
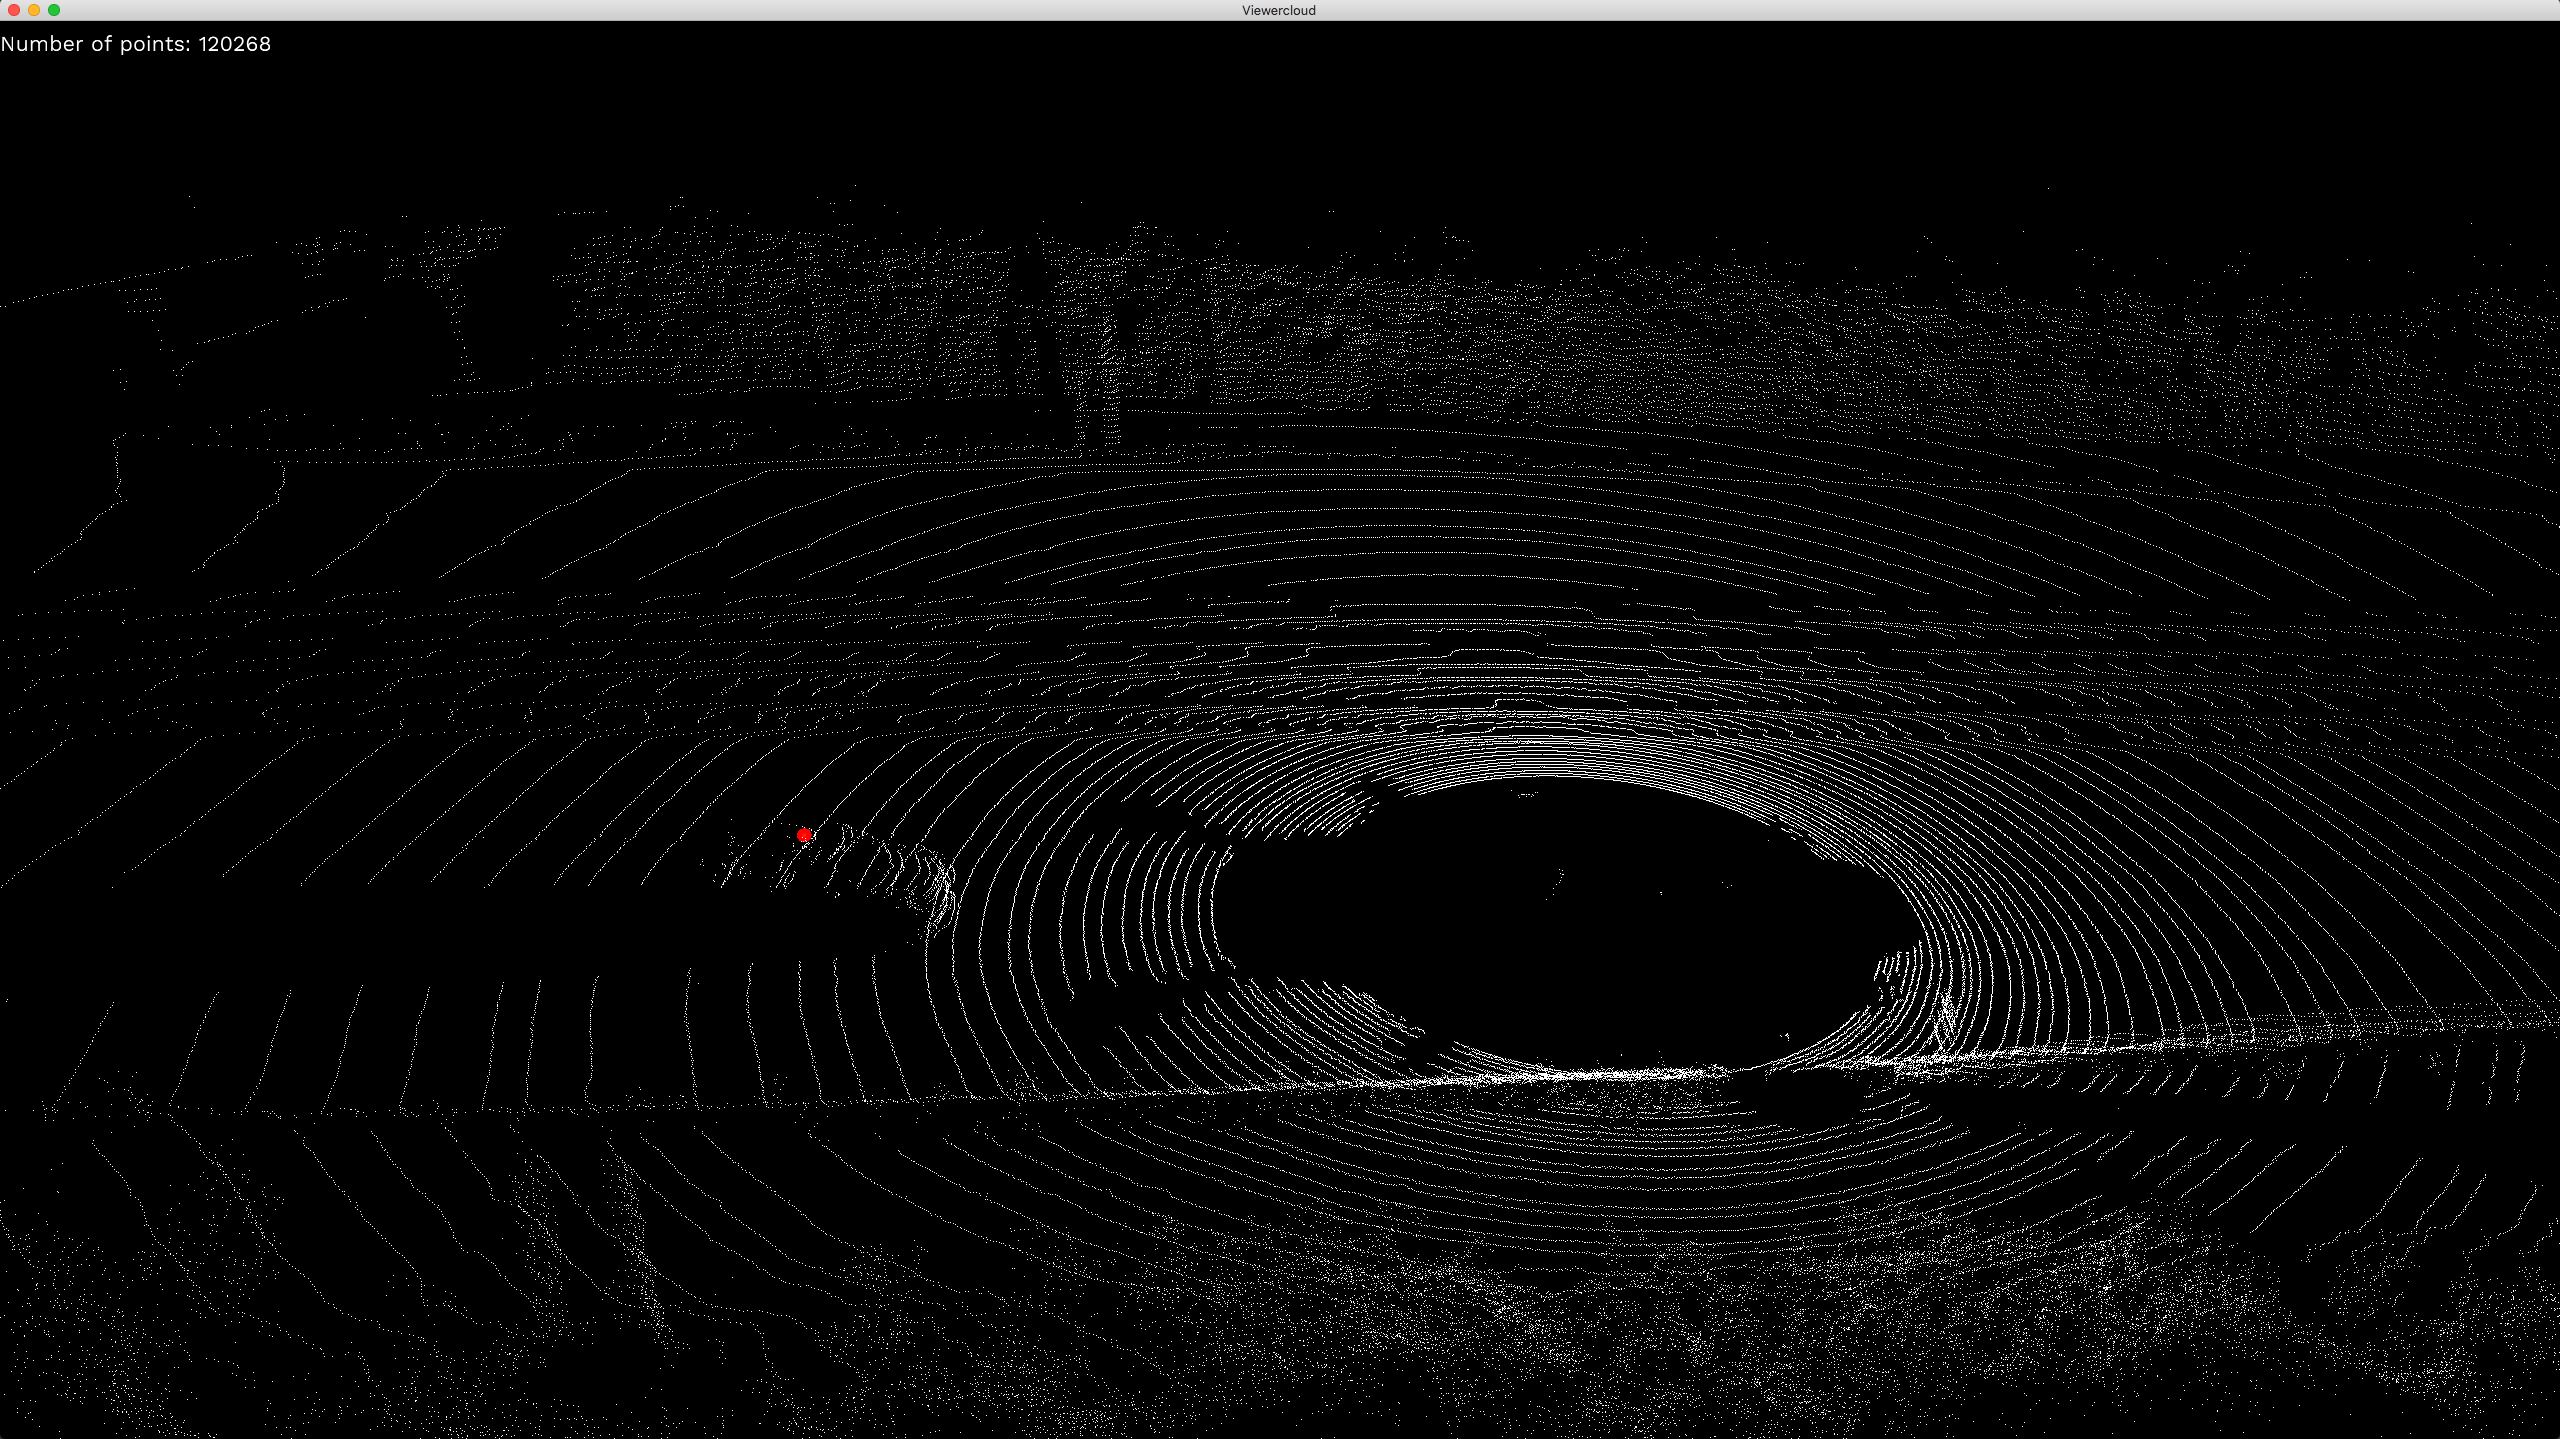
import numpy as np
import pyviewercloud as pyviewer

# Create a new viewer with a window size 1200x1800.
viewer = pyviewer.PointcloudViewer(1200, 1800, 15000)

# Load some pointcloud from the kitti dataset
kitti_point_cloud = np.fromfile("tests/data/kitti/velodyne/000001.bin", dtype=np.float32).reshape((-1, 4))[:,:3]
viewer.add_pointcloud(kitti_point_cloud, [255, 255, 255])

# Add some centroids to have the same color.
# Currently only support centroids as numpy.ndarray Nx3 in np.float32
centroids = np.array([[-11.5,0,-0.8]]).astype(np.float32)
viewer.add_centroid(centroids, [255, 0, 0])
viewer.show()
Release history Release notifications | RSS feed


Download files
Download the file for your platform. If you're not sure which to choose, learn more about installing packages.
Source Distributions
Built Distributions
Hashes for pyviewercloud-0.2.1-cp39-cp39-macosx_10_7_x86_64.whl
| Algorithm | Hash digest | |
|---|---|---|
| SHA256 | 10bb8bbb1137514e9f64fa572f79d4459c85c58e42fb4899a51432ecbb77128c |
|
| MD5 | dd7695ca6bcd19e4091e13b6897f513d |
|
| BLAKE2b-256 | 35f754890ff9b1798c639a524500706684db0cfeb016011f6a42ea7628e28bd4 |
Hashes for pyviewercloud-0.2.1-cp38-cp38-manylinux1_x86_64.whl
| Algorithm | Hash digest | |
|---|---|---|
| SHA256 | a33fd2cf718f2d643f00485a78550a0a1b76b502719e5b1ec425ee10af33edd9 |
|
| MD5 | 67080411b74f2c446ef63736f6d3c54a |
|
| BLAKE2b-256 | 943efb1b4a1e0094baab952fce4a17ff41f697db2b407d187ade9fbd3260d800 |
Hashes for pyviewercloud-0.2.1-cp38-cp38-macosx_10_7_x86_64.whl
| Algorithm | Hash digest | |
|---|---|---|
| SHA256 | 7a344ffac0957e96670abed4cb798698b44b68ddfa81338691361401a8482ddd |
|
| MD5 | 5df5725119b1771a4c1db66c6071005a |
|
| BLAKE2b-256 | 2685b3564c30d2a58662f57da5fe05f08984f10adc42bd7a6f1a3aa1517dfc7d |
Hashes for pyviewercloud-0.2.1-cp37-cp37m-macosx_10_7_x86_64.whl
| Algorithm | Hash digest | |
|---|---|---|
| SHA256 | e163b51967a27b1c97dc6a96ef19019076736d906af4a0c96d2755bd77e873b1 |
|
| MD5 | ef1ecafab83d0b88ea7ac228bc3bdc04 |
|
| BLAKE2b-256 | f08c2ae750bebe54a72af2998163e5356053112f3eae5c8448f8fd1a839a0907 |
Hashes for pyviewercloud-0.2.1-cp36-cp36m-manylinux1_x86_64.whl
| Algorithm | Hash digest | |
|---|---|---|
| SHA256 | 445721c61b1a10a388dc1d5505f540c7bccbb440f6f53e2dd97967d99da7d246 |
|
| MD5 | 46a843c13807ed205467626b7183228f |
|
| BLAKE2b-256 | b63d6ad1f7725824f1c9e91b35d0c6e52c41a9a009746fa79da0185d026bc7a0 |
Hashes for pyviewercloud-0.2.1-cp36-cp36m-macosx_10_7_x86_64.whl
| Algorithm | Hash digest | |
|---|---|---|
| SHA256 | 430d30d7ba9c32c4b3df96a4f19d5670e6408b5d3ba791ae8ee931f7adcf48bb |
|
| MD5 | ddfff2e45279428d832383107b56e655 |
|
| BLAKE2b-256 | 99969e4a0e91b749503a1760dc666fc0457251a4ba40fd05d1ed4308c9ba6798 |


