Pyadigraph turns your networkx into Adigraph latex package.
Project description
Pyadigraph turns your networkx into Adigraph latex package.
The Latex generated with this package requires Adigraph (1.7.0+) and the subfigures package.
Installation
After having installed Adigraph, you can run:
pip installed pyadigraphExample
from pyadigraph import Adigraph
import networkx as nx

A = Adigraph(
    vertices_color_fallback="gray!90",
    edges_color_fallback="gray!90",
    sub_caption="My adigraph number {i} of {n}",
    sub_label="adigraph_{i}_{n}",
    row_size=1,
    caption="A graph generated with python and latex.",
    label="pyadigraph_example"
)

A.add_graph(
    nx.bipartite.random_graph(4, 4, 1),
    vertices_color={
        0: 'red!90',
        1: 'red!90',
        4: 'cyan!90',
        7: 'cyan!90'
    })

A.save("test/result.tex", document=True)
Which when generated results in:
\documentclass{report}
\usepackage{adigraph}
\usepackage{subcaption}

\begin{document}
\begin{figure}
    \begin{subfigure}{1.0\textwidth}
        \NewAdigraph{myAdigraph}{
            0,red!90,:-0.4386601404141742\textwidth,0.2091077552922947\textwidth:;
            1,red!90,:-0.15708496776680972\textwidth,0.09630690244229406\textwidth:;
            2,gray!90,:0.43887677279554366\textwidth,-0.2079924280020609\textwidth:;
            3,gray!90,:0.15678823839504888\textwidth,-0.09746320565948384\textwidth:;
            4,cyan!90,:-0.3736460590634439\textwidth,-0.327631363498189\textwidth:;
            5,gray!90,:0.3735687548614322\textwidth,0.3275275669374224\textwidth:;
            6,gray!90,:-0.042735184609099336\textwidth,-0.4998552275122768\textwidth:;
            7,cyan!90,:0.0428925858015027\textwidth,0.5\textwidth:;
        }{
            0,4,gray!90,::;
            0,5,gray!90,::;
            0,6,gray!90,::;
            0,7,gray!90,::;
            1,4,gray!90,::;
            1,5,gray!90,::;
            1,6,gray!90,::;
            1,7,gray!90,::;
            2,4,gray!90,::;
            2,5,gray!90,::;
            2,6,gray!90,::;
            2,7,gray!90,::;
            3,4,gray!90,::;
            3,5,gray!90,::;
            3,6,gray!90,::;
            3,7,gray!90,::;
        }[]
        \myAdigraph{}
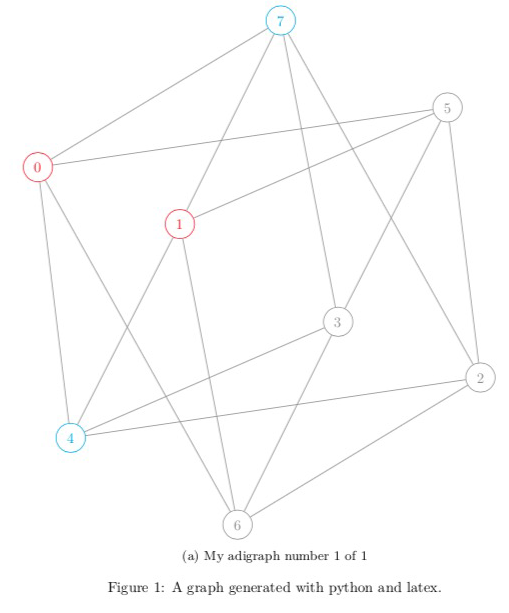
    \caption{My adigraph number 1 of 1}\label{adigraph_1_1}
    \end{subfigure}
    \caption{A graph generated with python and latex.}\label{pyadigraph_example}
\end{figure}
\end{document}
And when you compile this in your document you get:
Project details
Release history Release notifications | RSS feed
Download files
Download the file for your platform. If you're not sure which to choose, learn more about installing packages.
Source Distribution
pyadigraph-0.0.1.tar.gz
(12.3 kB
view hashes)


