A library for processing DNA Melting signal with feature extraction and automatic thresholding.


Project description

PyHRM
A library for processing DNA Melting signal with feature extraction and thresholding.
Installation • Features • Documentation • Help


PyHRM
PyHRM is a python based library for processing High Resolution Melting (HRM) data, especially, DNA melting signals to extact features like 'Melting Temperatures', 'Take-off and Touch-down points of melting signal (Temperature at which peak start rising and temperature at which peak falls down)','Peak prominences',and 'Area Under the curve'. Additionally, the library offers interactive visualization for DNA melting singal and vision based filtering, to eliminate noisy signals from the data and provides only genuine peaks with all the above mentioned features.
Installing with PIP
python -m pip install PyHRM
or
pip3 install PyHRM
Classifiers
| Development Status | 5 - Production/Stable |
| Intened Audience | Healthcare |
| License | OSI Approved :: MIT License |
| Operating System | Microsoft :: Windows :: Windows 10 |
| Programming Language | Python 3 |
Features
- Rapid preprocessing.
- Feature Extraction
- Tm (Melting Temperature (Max 2))
- Tstart (Starting temperature point)
- Tend (Ending Temperature)
- Prominence
- Area Under the curve
- Interactive Visulization.
- Computer Vision based thresholding for eliminating noisy signals.
- Report Generation.
Input Data format
Format
The input format should be as followed below. 'Text','X','Y'....
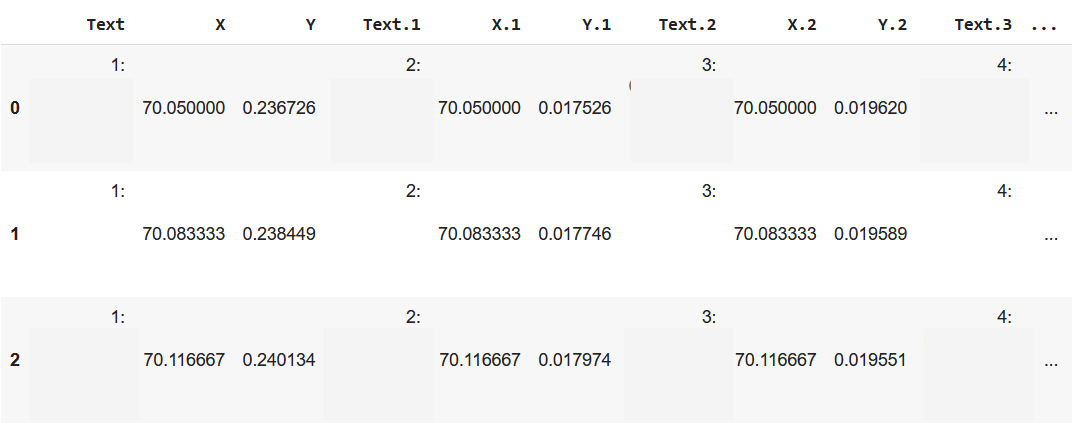
The current release only support .xls and .xlsx formats. Further updates on multiple file supports will be released in the upcoming versions.
Documentation
Import
from PyHRM import melt
Creating the class Instance
obj = melt.MeltcurveInterpreter()
PyHRM.melt.MeltcurveInterpreter.data_read
PyHRM.melt.MeltcurveInterpreter.data_read(data = None, path = None, labels =False, index = False, figure = False)
The function takes either a pandas dataframe or the path of the file (.xls, .xlsx). The method could read CT, MELT and raw fluorescence data as well.
Parameters: data : pandas dataframe object
A pandas dataframe with the specified input format of HRM data extracted from machines.
path : path of the file (.xls or .xlsx)
A path of the HRM data file extracted from machines.
labels : bool : default False
Returns a list containing dataframe and label of the samples given in the 'Text' attribute based on a boolean value.
index : bool : default False
Required a boolean value to remove the index (if the HRM data has.)
figure : bool : default False
Required a boolean value to render a interactive plot in the browser.
Returns: x, y cordinates : pandas.core.frame.DataFrame
A pandas dataframe with the temperature co-ordinates as 'X' and the signal co-ordinates as 'Y','Y.1'..'Y.n'
x,y cordinates and labels : list
If lables is True, returns a list containing a dataframe and lables
Warns: ValueError
Raised when unsupported data format passed.
Example
from PyHRM import melt
obj = melt.MeltcurveInterpreter()

#reading the HRM data
hrmdata = obj.data_read(path = './path/file.xls', figure = True)
Alternatively,
import pandas as pd
import openpyxl
from PyHRM import melt
obj = melt.MeltcurveInterpreter()

#reading data with pandas
data = pd.read_excel('./path/file.xls', engine = 'xlrd')

#passing the dataframe to the function
hrmdata = obj.data_read(data = data, figure = True)
PyHRM.melt.MeltcurveInterpreter.plot
PyHRM.melt.MeltcurveInterpreter.plot(data,save = False)
The function takes a pandas dataframe contains signal values and render back the respective figure. The plot function takes any data like CT, MELT and as well as raw fluorescence, and gives back the corresponding visulazation.
Parameters: data : pandas dataframe object
A pandas dataframe contains signal values.
save : bool : default False
Required a boolean value to save the plot in a figure object.
Returns: figure: plotly.graph_objs._figure.Figure
Returns an interactive plotly figure object.
Example
from PyHRM import melt
obj = melt.MeltcurveInterpreter()

#reading the HRM data
hrmdata = obj.data_read(path = './path/file.xls')

#visualizing the data
fig = obj.plot(data = hrmdata, save = True)
fig.show()
PyHRM.melt.MeltcurveInterpreter.melt_conversion
PyHRM.melt.MeltcurveInterpreter.melt_conversion(figure = False, return_value =False, download = False)
This methods only works for raw fluorescence data, and the input of this method is the class member itself. It converts the raw fluorescence signals into melting signals with signal smoothening.
Note: This method is the beta version of the library, the results may not be acuratae or appropriate and this is still in development
Parameters: figure : bool : default False
Required a boolean value to render the resultant values as a plot.
return_value : bool : default False
Required a boolean value to return the result as dataframe.
download : bool : default False
Required a boolean value to save the resultant values as comma separated values.
Returns: melt signal co-ordinates: pandas.core.frame.DataFrame
Returns a dataframe, contains melting signal co-ordinates.
Example
from PyHRM import melt
obj = melt.MeltcurveInterpreter()

#reading the raw fluorescence data
rfdata = obj.data_read(path = './path/file.xls')

meltdata = obj.melt_conversion(return_value = True, figure = True, download = True)
PyHRM.melt.MeltcurveInterpreter.feature_detection
PyHRM.melt.MeltcurveInterpreter.feature_detection(return_values =False, download = False)
This methods performs feature extraction process on melting signal data, that extracts features like 'Tm','Tstart','Tend','Prominence','Area under the curve'. This also performs noise elimination using a trained CNN model embedded in the package. The input of the method is the class member itself.
Parameters: return_values : bool : default False
Required a boolean value to return the result as dataframe.
download : bool : default False
Required a boolean value to save the resultant values as comma separated values.
Returns: Features of the signal: pandas.core.frame.DataFrame
Returns a dataframe, contains features of melting signals
Example
from PyHRM import melt
obj = melt.MeltcurveInterpreter()

#reading the HRM data
hrmdata = obj.data_read(path = './path/file.xls')

#Extracting features of the melt signals
features = obj.feature_detection(return_values = True)
PyHRM.melt.MeltcurveInterpreter.report
PyHRM.melt.MeltcurveInterpreter.report()
The method generates a report with the feature extracting data and it's corresponding melting signal figures.
Parameters: None
Example
from PyHRM import melt
obj = melt.MeltcurveInterpreter()

#reading the HRM data
hrmdata = obj.data_read(path = './path/file.xls')

#Extracting features of the melt signals
features = obj.feature_detection(return_values = True)

#Generating the report
obj.report()
Getting Help
If you need to get in touch with the team, please contact through email address: feusion.ai@gmail.com
Meet the Team
The developers in this project are post graduate students in the Department of Computer Applications @ Bharathiar University
 Rajagopal S |
 Vignesh R |
 Senthil Kumar N |
Release history Release notifications | RSS feed


Download files
Download the file for your platform. If you're not sure which to choose, learn more about installing packages.


