A package for displaying TSI graph based on NOAA

Project description
noaatsi

takefuji (2022) noaatsi: a PyPI for displaying TSI graph based on NOAA [Source Code]. https://doi.org/10.24433/CO.6916537.v1
This is under review.
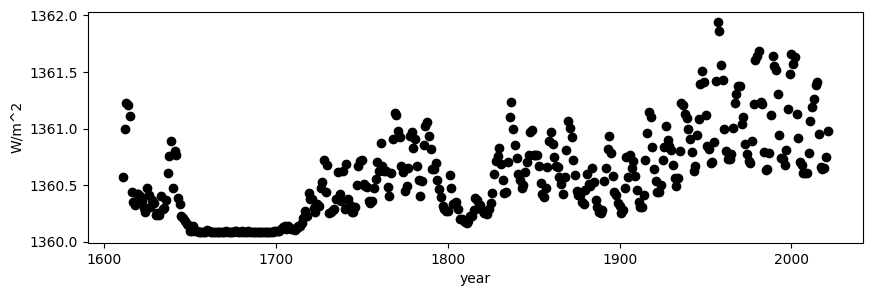
noaatsi is a PyPI package application to scrape the updated data from NOAA on TSI and to display the TSI graph. Data is stored in the following site which will be automatically scraped by noaatsi:
NOAA file is based on netCDF4. In order to read .nc file, netCDF4 library is needed. To install it, run the following command.
$ pip install netCDF4
In order to install noaatsi, run the following command.
$ pip install noaatsi
To generate TSI file (tsi.csv) and the graph on the screen (tsi.png), run the following command.
$ noaatsi
noaatsi.png is finally generated.
Release history Release notifications | RSS feed


Download files
Download the file for your platform. If you're not sure which to choose, learn more about installing packages.


