Integrates ChartFactor with Jupyter Notebooks

Project description
ChartFactor for Python
ChartFactor Py is built on top of ChartFactor, the lightweight visual analytics platform. It includes ChartFactor Studio and the ChartFactor Toolkit between other components.
Installing Chartfactor Py
Visit the installation section in the ChartFactor Py documentation for a detailed guide.
Usage
Create a new notebook and do the following
Cell 1
from chartfactor import *
import pandas as pd
Cell 2
titanic = pd.read_csv('https://chartfactor.com/resources/tutorials/titanic.csv')
Cell 3
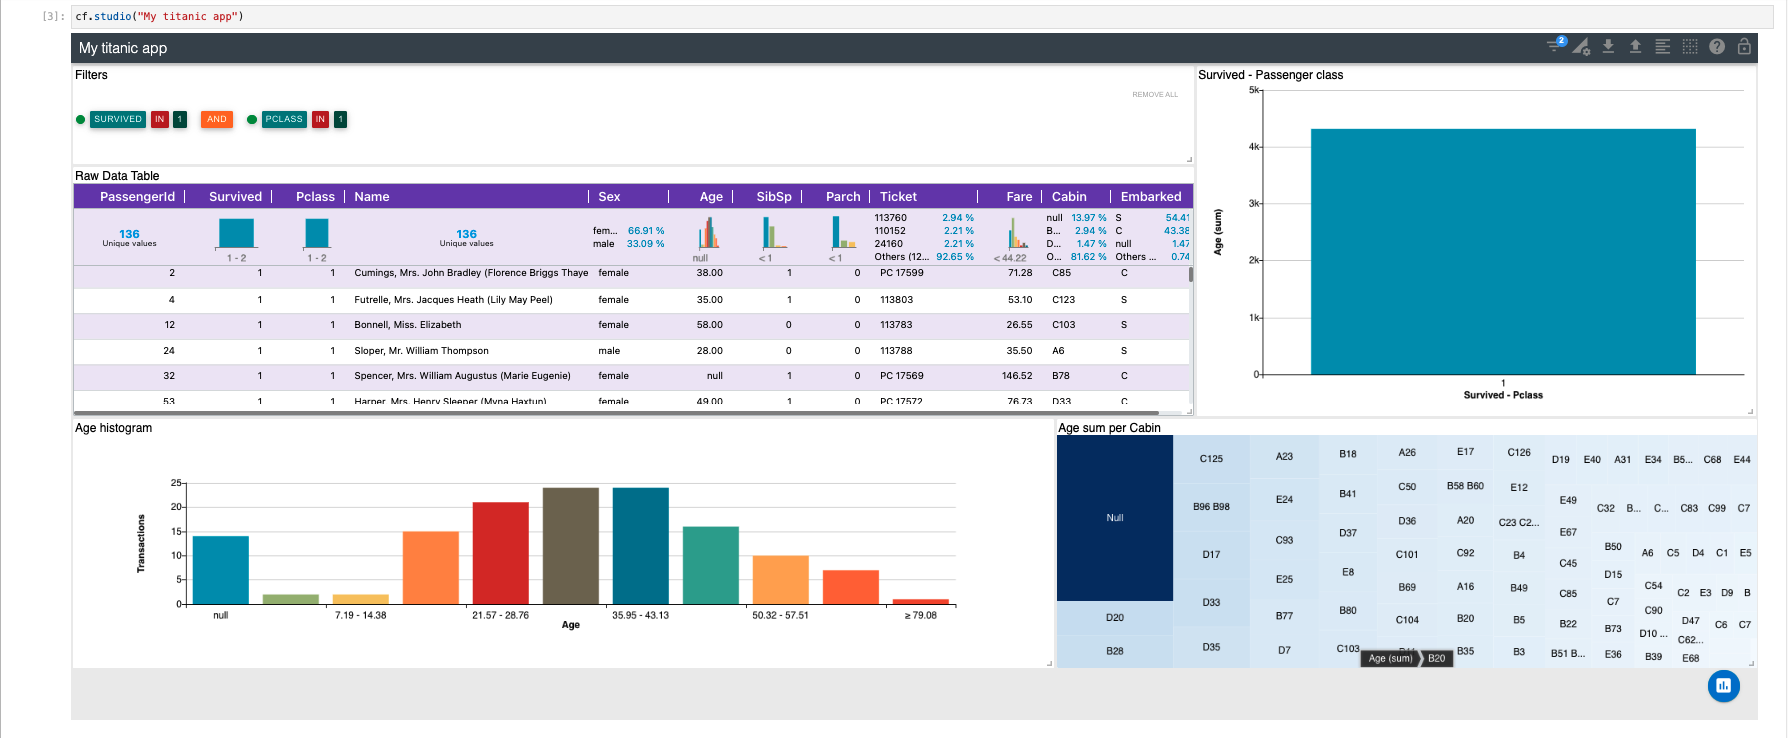
cf.studio("My titanic app")
The output will display an empty Studio app, select the dataframe in the Data Sources window
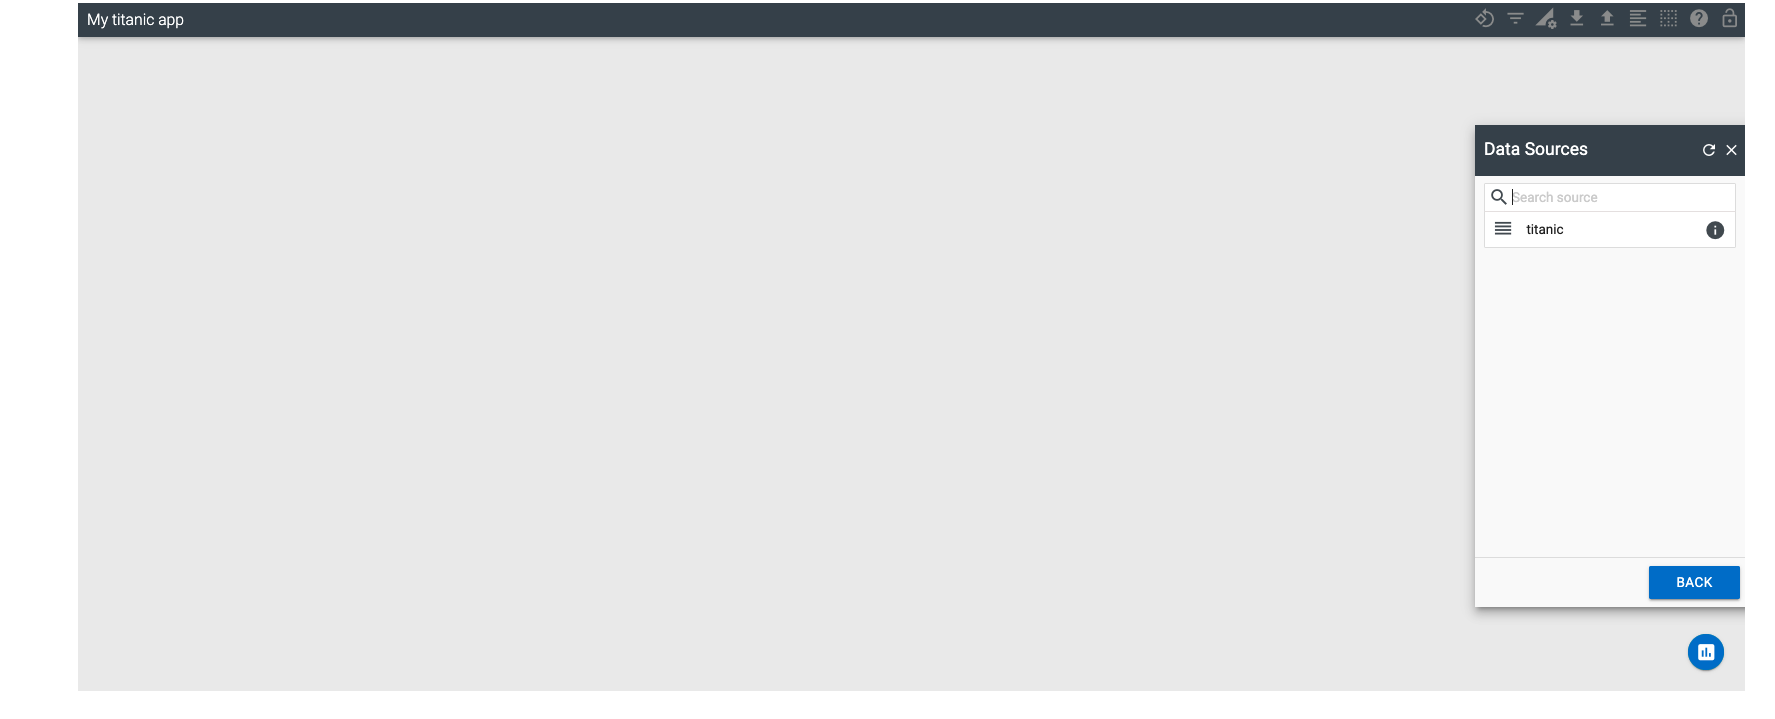
Then, add some widgets like Raw Data Table, Bars, Tree Map, etc...
Release history Release notifications | RSS feed


Download files
Download the file for your platform. If you're not sure which to choose, learn more about installing packages.
Source Distribution
chartfactor-5.0.6.tar.gz
(209.4 kB
view hashes)
Built Distribution
Close
Hashes for chartfactor-5.0.6-py3-none-any.whl
| Algorithm | Hash digest | |
|---|---|---|
| SHA256 | 52f3ddcf8ed2c01d58b4153a5bc2cd5c9a60ec7243635e5f8106f60fac62fd1a |
|
| MD5 | 78063c2a20fbf19ff9895f48b227eb6e |
|
| BLAKE2b-256 | 322156dd390135696e7c335b53a9799e74f443d07591f6f45608f13859c3761d |


