A fast and covariate-adaptive method for multiple hypothesis testing

Project description
AdaFDR


A fast and covariate-adaptive method for multiple hypothesis testing.
Software accompanying the paper "AdaFDR: a Fast, Powerful and Covariate-Adaptive Approach to Multiple Hypothesis Testing", 2018.
Requirement
- AdaFDR runs on python 3.6
Installation
pip install adafdr
Usage
Import package
adafdr.method contains all methods while adafdr.data_loader contains the data.
They can be imported as
import adafdr.method as md
import adafdr.data_loader as dl
Other ways of importing are usually compatible. For example, one can import the package with import adafdr
and call method xxx in the method module via adafdr.method.xxx()
Input format
For a set of N hypotheses, the input data includes the p-values p and the d-dimensional covariate x,
with the following format:
p: (N,) numpy.ndarray.x: (N,d) numpy.ndarray.
When d=1, x is allowed to be either (N,) numpy.ndarray
or (N,1) numpy.ndarray.
Covariate visualization
The covariate visualization method adafdr_explore can be used as
adafdr.method.adafdr_explore(p, x, output_folder=None, covariate_type=None)
-
If the
output_folderis a filepath (str) instead ofNone, the covariate visualization figures will be saved inoutput_folder. Otherwise, they will show up in the console. -
covariate_type: a length-d python list with values 0/1. It specifies the type of each covariate: 0 means numerical/ordinal while 1 means categorical. For example,covariate_type=[0,1]means there are 2 covariates, the first is numerical/ordinal and the second is categorical. If not specified, a covariate with more than 75 distinct values is regarded as numerical/ordinal and otherwise categorical. -
See also doc for more details.
Multiple testing
The multiple hypothesis testing method adafdr_test can be used as
- fast version (default):
res = adafdr.method.adafdr_test(p, x, alpha=0.1, covariate_type=None)
- regular version:
res = adafdr.method.adafdr_test(p, x, alpha=0.1, fast_mode=False, covariate_type=None)
- regular version with multi-core:
res = adafdr.method.adafdr_test(p, x, alpha=0.1, fast_mode=False, single_core=False, covariate_type=None)
resis a dictionary containing the results, including:res['decision']: a (N,) boolean vector, decision for each hypothesis with value 1 meaning rejection.res['threshold']: a (N,) float vector, threshold for each hypothesis.
-
If the
output_folderis a filepath (str) instead ofNone, the logfiles and some intermediate results will be saved inoutput_folder. Otherwise, they will show up in the console. -
covariate_type: a length-d python list with values 0/1. It specifies the type of each covariate: 0 means numerical/ordinal while 1 means categorical. For example,covariate_type=[0,1]means there are 2 covariates, the first is numerical/ordinal and the second is categorical. If not specified, a covariate with more than 75 distinct values is regarded as numerical/ordinal and otherwise categorical. -
See also doc for more details.
Example on airway RNA-seq data
The following is an example on the airway RNA-seq data used in the paper.
Import package and load data
Here we load the airway data used in the paper. See vignettes for other data accompanied with the package.
import adafdr.method as md
import adafdr.data_loader as dl
p,x = dl.data_airway()
Covariate visualization using adafdr_explore
md.adafdr_explore(p, x, output_folder=None)
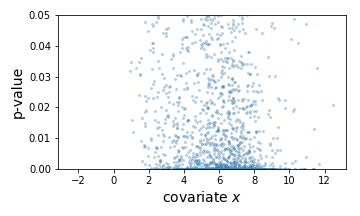
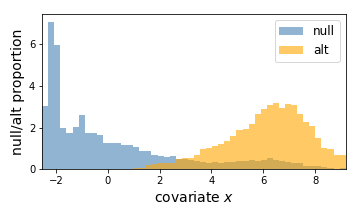
Here, the left is a scatter plot of each hypothesis with p-values (y-axis) plotted against the covariate (x-axis). The right panel shows the estimated null hypothesis distribution (blue) and the estimated alternative hypothesis distribution (orange) with respect to the covariate. Here we can conclude that a hypothesis is more likely to be significant if the covariate (gene expression) value is higher.
Multiple hypothesis testing using adafdr_test
res = md.adafdr_test(p, x, fast_mode=True, output_folder=None)
Here, the learned threshold res['threshold'] looks as follows.
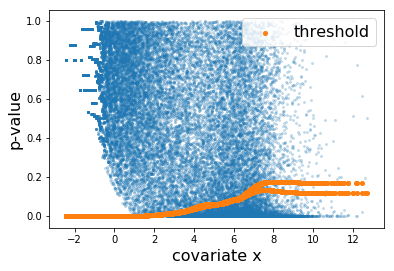
Each orange dot corresponds to the threhsold to one hypothesis. The discrepancy at the right is due to the difference between the thresholds learned by the two folds.
Quick Test
Here is a quick test. First check if the package can be successfully imported:
import adafdr.method as md
import adafdr.data_loader as dl
Next, run a small example which should take a few seconds:
import numpy as np
p,x,h,_,_ = dl.load_1d_bump_slope()
res = md.adafdr_test(p, x, alpha=0.1)
t = res['threshold']
D = np.sum(p<=t)
FD = np.sum((p<=t)&(~h))
print('# AdaFDR successfully finished!')
print('# D=%d, FD=%d, FDP=%0.3f'%(D, FD, FD/D))
It runs AdaFDR-fast on a 1d simulated data. If the package is successfully imported, the result should look like:
# AdaFDR successfully finished!
# D=837, FD=79, FDP=0.094
R API of python package
R API of this package can be found here.
Citation information
Zhang, Martin J., Fei Xia, and James Zou. "AdaFDR: a Fast, Powerful and Covariate-Adaptive Approach to Multiple Hypothesis Testing." bioRxiv (2018): 496372.
Xia, Fei, et al. "Neuralfdr: Learning discovery thresholds from hypothesis features." Advances in Neural Information Processing Systems. 2017.
Release history Release notifications | RSS feed


Download files
Download the file for your platform. If you're not sure which to choose, learn more about installing packages.


