Generates A/B/n test groups

Project description

ABSplit
Split your data into matching A/B/n groups


Table of Contents
About the project
ABSplit is a python package that uses a genetic algorithm to generate as equal as possible A/B, A/B/C, or A/B/n test splits.
The project aims to provide a convenient and efficient way for splitting population data into distinct groups (ABSplit), as well as and finding matching samples that closely resemble a given original sample (Match).
Whether you have static population data or time series data, this Python package simplifies the process and allows you to analyze and manipulate your population data.
This covers the following use cases:
- ABSplit class: Splitting an entire population into n groups by given proportions
- Match class: Finding a matching group in a population for a given sample
Calculation
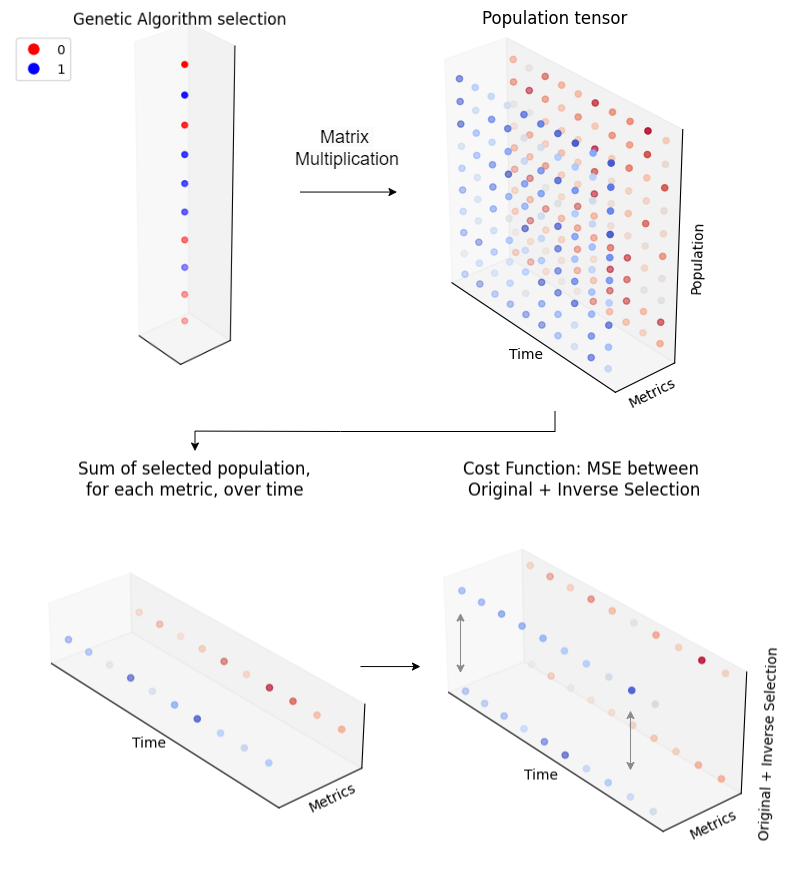
ABSplit standardises the population data (so each metric is weighted as equally as possible), then pivots it into a three-dimensional array, by metrics, individuals, and dates.
The selection from the genetic algorithm, along with its inverse, is applied across this array with broadcasting to compute the dot products between the selection and the population data.
As a result, aggregated metrics for each group are calculated. The Mean Squared Error is calculated for each metric within the groups and then summed for each metric. The objective of the cost function is to minimize the overall MSE between these two groups, ensuring the metrics of both groups track each other as similarly across time as possible.
Getting Started
Use the package manager pip to install ABSplit and it's prerequisites.
ABSplit requires pygad==3.0.1
Installation
pip install absplit
Tutorials
Please see this colab for a range of examples on how to use ABSplit and Match
Do it yourself
See this colab to learn how ABSplit works under the hood, and how to build your own group splitting tool using PyGAD,
Usage
from absplit import ABSplit
import pandas as pd
import datetime
import numpy as np

# Synthetic data
data_dct = {
    'date': [datetime.date(2030,4,1) + datetime.timedelta(days=x) for x in range(3)]*5,
    'country': ['UK'] * 15,
    'region': [item for sublist in [[x]*6 for x in ['z', 'y']] for item in sublist] + ['x']*3,
    'city': [item for sublist in [[x]*3 for x in ['a', 'b', 'c', 'd', 'e']] for item in sublist],
    'metric1': np.arange(0, 15, 1),
    'metric2': np.arange(0, 150, 10)
}
df = pd.DataFrame(data_dct)

# Identify which columns are metrics, which is the time period, and what to split on
kwargs = {
    'metrics': ['metric1', 'metric2'],
    'date_col': 'date',
    'splitting': 'city'
}

# Initialise
ab = ABSplit(
    df=df,
    split=[.5, .5],  # Split into 2 groups of equal size
    **kwargs,
)

# Generate split
ab.run()

# Visualise generation fitness
ab.fitness()

# Visualise data
ab.visualise()

# Extract bin splits
df = ab.results

# Extract data aggregated by bins
df_agg = ab.aggregations

# Extract summary statistics
df_dist = ab.distributions    # Population counts between groups
df_rmse = ab.rmse             # RMSE between groups for each metric
df_mape = ab.mape             # MAPE between groups for each metric
df_totals = ab.totals         # Total sum of each metric for each group
API Reference
Absplit
ABSplit(df, metrics, splitting, date_col=None, ga_params={}, metric_weights={}, splits=[0.5, 0.5], size_penalty=0)
Splits population into n groups. Mutually exclusive, completely exhaustive
Arguments:
df(pd.DataFrame): Dataframe of population to be splitmetrics(str, list): Name of, or list of names of, metric columns in DataFrame to be considered in splitsplitting(str): Name of column that represents individuals in the population that is getting split. For example, if you wanted to split a dataframe of US counties, this would be the county name columndate_col(str, optional): Name of column that represents time periods, if applicable. If left empty, it will perform a static split, i.e. not across timeseries, (defaultNone)ga_params(dict, optional): Parameters for the genetic algorithmpygad.GAmodule parameters, see here for arguments you can pass (default:{})splits(list, optional): How many groups to split into, and relative size of the groups (default:[0.5, 0.5], 2 groups of equal size)size_penalty(float, optional): Penalty weighting for differences in the population count between groups (default:0)sum_penalty(float, optional): Penalty weighting for the sum of metrics over time. If this is greater than zero, it will add a penalty to the cost function that will try and make the sum of each metric the same for each group (default:0)cutoff_date(str, optional): Cutoff date between fitting and validation data. For example, if you have data between 2023-01-01 and 2023-03-01, and the cutoff date is 2023-02-01, the algorithm will only perform the fit on data between 2023-01-01 and 2023-02-01. IfNone, it will fit on all available data. If cutoff date is provided, RMSE scores (gotten by using theab.rmseattribute) will only be for validation period (i.e., from 2023-02-01 to end of timeseries)missing_dates(str, optional): How to deal with missing dates in time series data, options:['drop_dates', 'drop_population', '0', 'median'](default:median)metric_weights(dict, optional): Weights for each metric in the data. If you want the splitting to focus on one metrics more than the other, you can prioritise this here (default:{})
Match
Match(population, sample, metrics, splitting, date_col=None, ga_params={}, metric_weights={})
Takes DataFrame sample and finds a comparable group in population.
Arguments:
population(pd.DataFrame): Population to search for comparable group (Must exclude sample data)sample(pd.DataFrame): Sample we are looking to find a match for.metrics(str, list): Name of, or list of names of, metric columns in DataFramesplitting(str): Name of column that represents individuals in the population that is getting splitdate_col(str, optional): Name of column that represents time periods, if applicable. If left empty, it will perform a static split, i.e. not across timeseries, (defaultNone)ga_params(dict, optional): Parameters for the genetic algorithmpygad.GAmodule parameters, see here for arguments you can pass (default:{})splits(list, optional): How many groups to split into, and relative size of the groups (default:[0.5, 0.5], 2 groups of equal size)metric_weights(dict, optional): Weights for each metric in the data. If you want the splitting to focus on one metrics more than the other, you can prioritise this here (default:{})
Contributing
I welcome contributions to ABSplit! For major changes, please open an issue first to discuss what you would like to change.
Please make sure to update tests as appropriate.
License
Release history Release notifications | RSS feed


Download files
Download the file for your platform. If you're not sure which to choose, learn more about installing packages.
Source Distribution
Built Distribution
Hashes for absplit-1.4.4-py2.py3-none-any.whl
| Algorithm | Hash digest | |
|---|---|---|
| SHA256 | 937d0188a193549f5f20ebe29c3bbc1cb5091ed6cabc7940a05d97e7abae25b4 |
|
| MD5 | 3915de92d6018e45f03dabc744941397 |
|
| BLAKE2b-256 | 579683749e5a5905f120af2f1e552b0dbd874417a439d5f960a401e83eca1d72 |


