d3-gridding
![]()


Create rapid mock-ups for D3 charts, using data-driven grids.
|

|
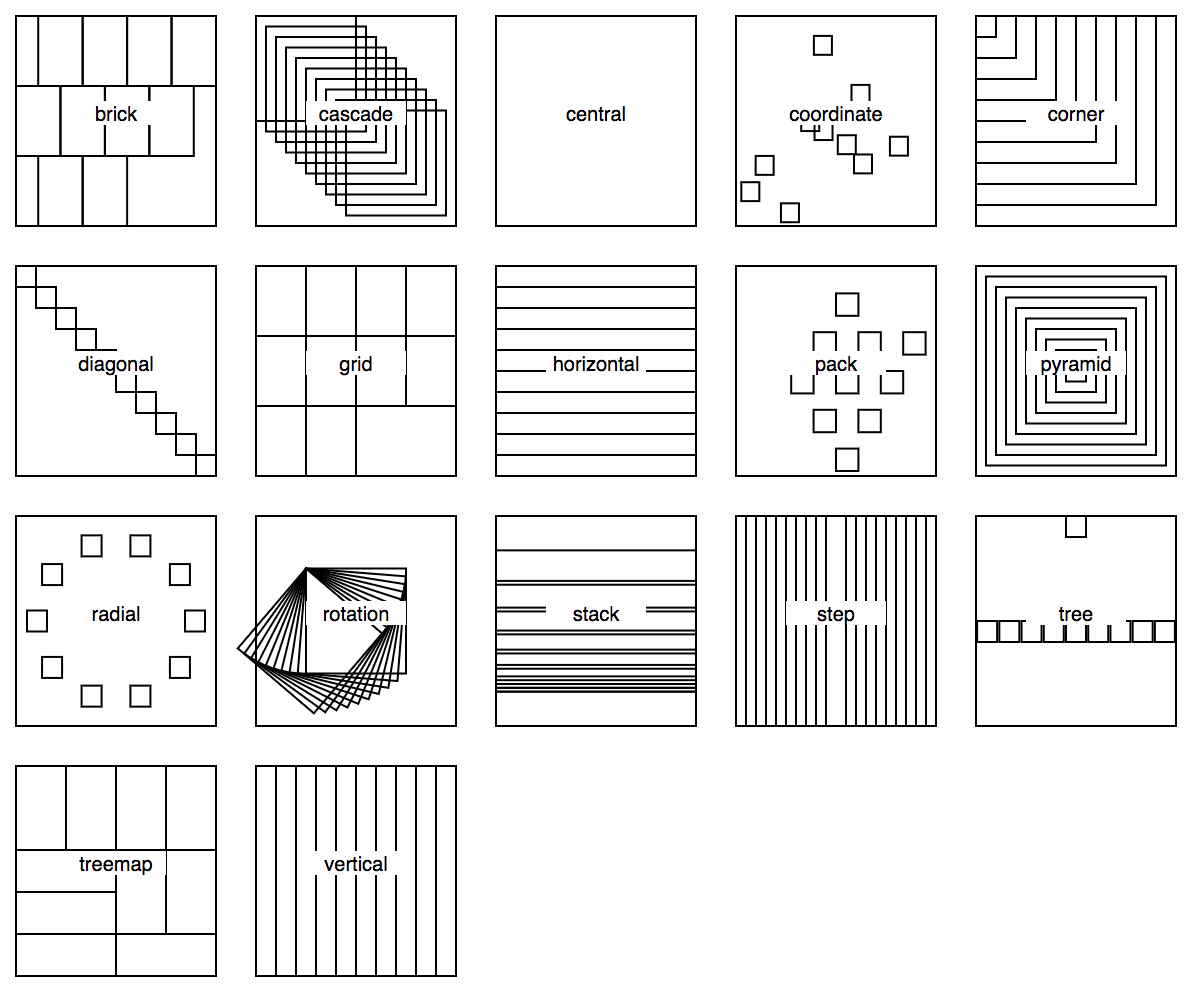
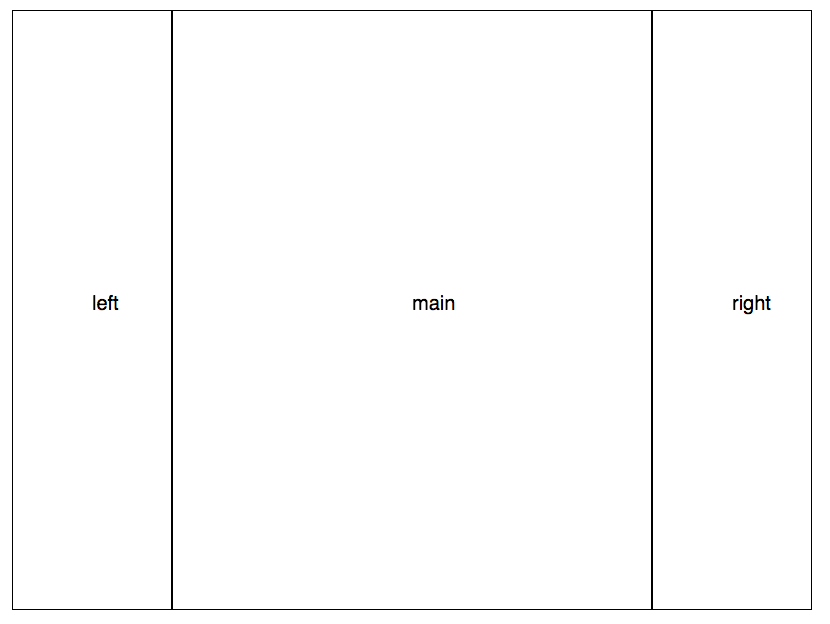
Left: grids available in the toolkits; Right: layouts for page partition to nest grids within
Example
<!DOCTYPE html><meta charset="utf-8"><body><script src="https://unpkg.com/d3@5"></script><script src="https://unpkg.com/d3-gridding@0.1"></script><script> var width = 400 height = 300; var gridding = d3 sizewidth height ; var data = d3; var griddingData = ; var svg = d3 ; svg datagriddingData style"fill" "none" style"stroke" "black" </script></body>Output below and live coding version.

The code snippet below lets you create dots organized as a grid:
d3 data d3 size800 600 d3 ;More Examples
-
Gallery of examples in this repository
-
Simple grid example using live coding
-
Search for code examples using
d3-griddingon blockbuilder.org -
List of tutorials to add or customize grids
-
Some creative blocks using d3-gridding using generative coding
How to use it
To install, use NPM npm install d3-gridding or download the latest release.
To use, include the d3-gridding.js JavaScript file in your HTML code or use the following:
Output below and live coding version.

The magic happens with gridding which turns an array of JavaScript Objects, into another array with additional attributes:
> gridding([{}, {}, {}])
[▶ Object, ▶ Object, ▶ Object]
▼ Object x: 0 y: 300 cx: 300 cy: 300 height: 600 width: 2666666666666667- (
x,y) the computed coordinates (which can be seen astop/leftvalues) - (
height,width) gives the bounding box if combined with (x,y) - (
cx,cy) the center of the bounding box
It becomes interesting when changing the type of layout, which will organize the elements differently, by changing the value of the attributes above:
gridding; var points = svgPoints data;That's pretty much what you need to know at this point to get started. Below is a list of functions that will let you customize the layouts and retrieve internal values.
Note that parameters can also be set as group, using a JSON object:
var gridding = d3.gridding()
  .params({
    "size": [800, 600],
    "mode": "vertical",
    "offset": function(d) { return [d.x, d.y]; }
  });
Layouts
Layouts help to divde and organize a page into regions. Layouts actually are grids that are generated with some dataset that can be seen as proportions. Below is an example of dataset that is from this list of layouts. See the layout list and source code.
var layout = {
  "name": "basic3columns",
  "values": [
    {"index": 1, "__x": 10, "__y": 10, "__height": 0, "__width": 0},
    {"index": 2, "__x": 0, "__y": 0, "__height": 10, "__width": 2, "name": "left"},
    {"index": 3, "__x": 2, "__y": 0, "__height": 10, "__width": 6, "name": "main"},
    {"index": 4, "__x": 8, "__y": 0, "__height": 10, "__width": 2, "name": "right"}]
};
The result is as below and can be found on this page.
Then to draw the layout you may need to set the grid parameters accordingly as below.
var gridding = d3.gridding()
  .params({
    "size": [width, height],
    "offset": [0, 0],
    "mode": "coordinate",
    "valueX": "__x",
    "valueY": "__y",
    "valueWidth": function(d) { return d["__width"]},
    "valueHeight": function(d) { return d["__height"]}
  });
And finally drawing the layout the very same way one draws a grid.
svgSquares.selectAll(".square")
    .data(gridding(layout.values))
  .enter().append("rect")
    .attr("class", "square")
      .attr("width", function(d) { return d.width; })
      .attr("height", function(d) { return d.height; })
      .attr("transform", function(d) {
        return "translate(" + d.x + "," + d.y + ")";
      });
Nesting
One of the most powerful property of grids is to allow their nesting
-Simple recursive function
-How to set the grids in one param element?
Rendering methods
d3-gridding is agnostic to the rendering method
SVG
Canvas
Divs
WebGL
API
# d3.gridding().mode(mode)
The mode parameter sets the layout:
vertical- vertical partitioning of value.valueHeight()and vertical offset.valueX()horizontal- horizontal partitioning of value.valueWidth()and vertical offset.valueY()central- overlapping partitioninggrid- classic grid partitioningcoordinate- position (.valueX()and.valueY()) and dimensions (.valueWidth(),.valueHeight()) can be set with relative or absolute positionsradial- circular partitioning (e.g. pie chart with uniform wedges)treemap- using d3.treemap() layoutpack- using d3.pack()pyramid- centered grids overlaysstack- using d3.stack()diagonal- aligned on the diagonalcascade- like diagonal but with larger and overlapping cellsidentity- does nothing, returns same values
Others
-
gridding.modes()returns the list of all available modes as an array, e.g.["brick", "cascade", "central", "coordinate", "corner", "diagonal", "grid", "horizontal", "pack", "pyramid", "radial", "stack", "step", "tree", "treemap", "vertical"] -
gridding.modes("brick")returns the properties for a single mode that are exposed as [an array of key/values] such as[{"key": "orient", "value": "left"}, {"key": "valueX", "value": null}]that contain both possible values and the default ones.
# d3.gridding().sort([compare])
Sets the sort function, similar to D3's and defaults to:
{ return a - b; }Thus you can use D3's sorting functions such as d3.ascending and d3.descending.
# d3.gridding().value([accessor])
Sets the value accessor function, similar to D3's and defaults to:
{ return d; }# d3.gridding().valueY([string || accessor])
The value can either be a traditional accessor function but for attributes this time, or the data attribute itself directly as a string:
or
# d3.gridding().valueY([string || accessor])
See valueY().
# d3.gridding().padding(value)
Sets the local offset between grid elements (default: 1px).
# d3.gridding().offset(value)
Sets the global offset for all elements (default: 0px) as an array [left, top].
# d3.gridding().orient("up" | "down" (default))
Orients the grid & diagonal layouts either upwards or downwards when adding / removing cells.
# d3.gridding().radius(value)
Radius for radial layout.
# d3.gridding().sort(value || function)
Sort by attribute value (or function if value is a function.
# d3.sortAsc().sortAsc(true || false)
By default, ascending sorting by sort attribute || function defined previously.