Apollo Opentracing 


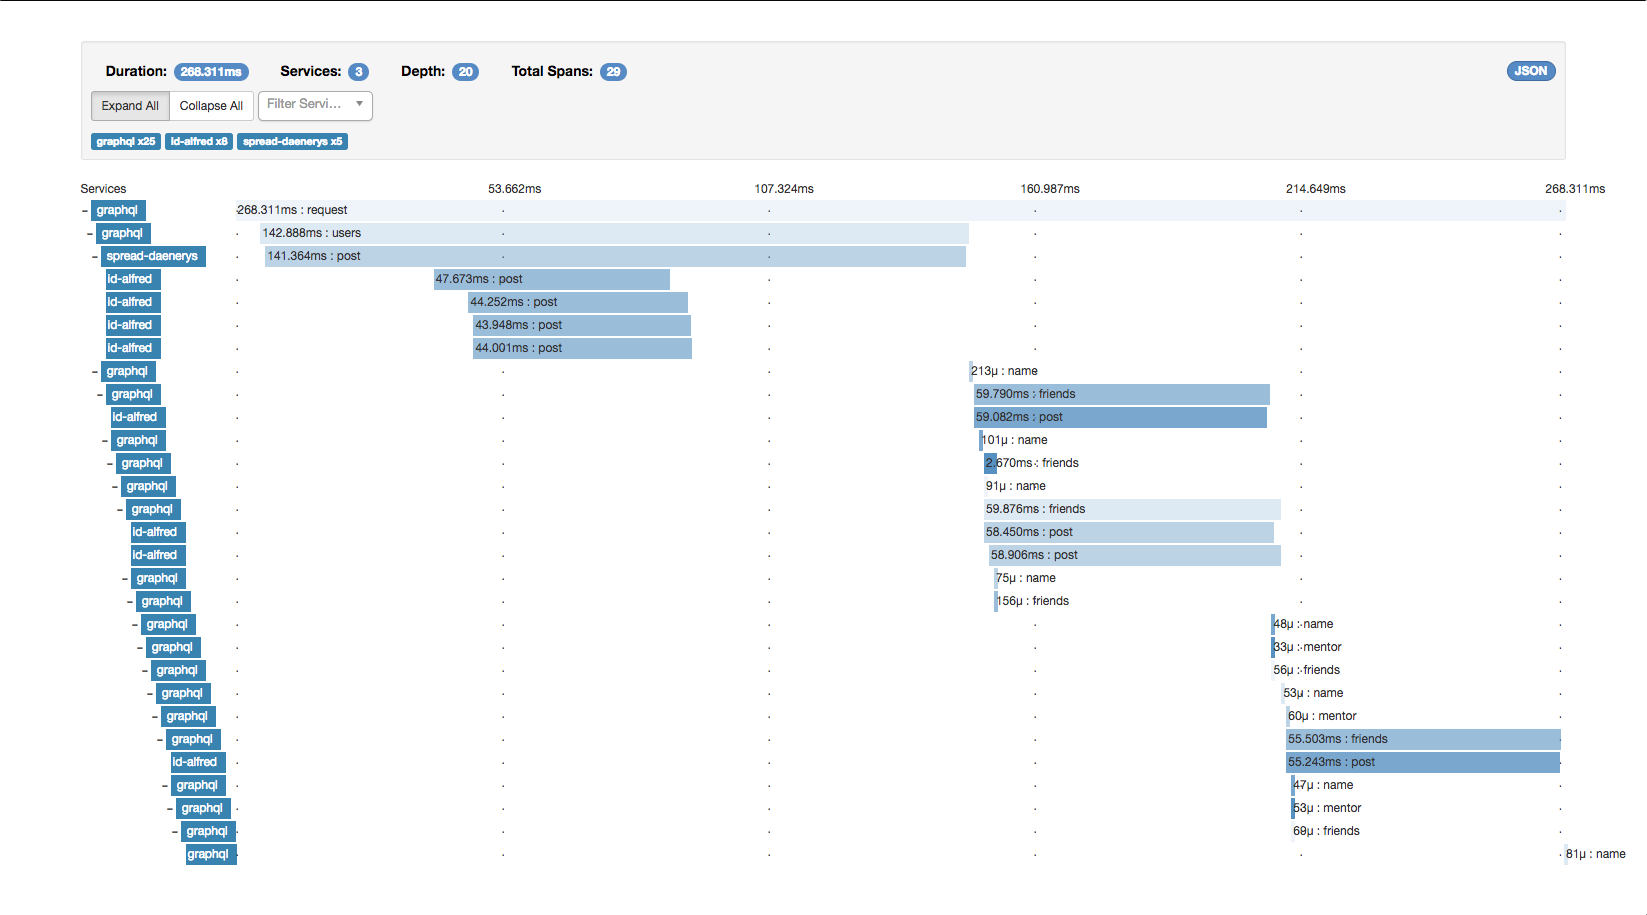
Apollo Opentracing allows you to integrate open source baked performance tracing to your Apollo server based on industry standards for tracing.
🚀 Request & Field level resolvers are traced out of the box🔍 Queries and results are logged, to make debugging easier⚙️ Select which requests you want to trace🔗 Spans transmitted through the HTTP Headers are picked up🔧 Use the opentracing compatible tracer you like, e.g.🦖 Support from node 6 on
Installation
Run npm install --save apollo-opentracing given that you already setup an opentracing tracer accordingly.
Setup
We need two types of tracer (which could be identical if you like):
- server: Only used for the root (the first span we will start)
- local: Used to start every other span
const { graphqlExpress } = require("apollo-server-express");
const {serverTracer, localTracer} = require("./tracer");
+const OpentracingPlugin = require("apollo-opentracing").default;

app.use(
  "/graphql",
  bodyParser.json(),
  graphqlExpress({
    schema,
+   plugins: [OpentracingPlugin({
+     server: serverTracer,
+     local: localTracer,
+   })]
  })
)
Connecting Services
To connect other services you need to use the opentracing inject function of your tracer.
We pass the current span down to your resolvers as info.span, so you should use it.
You can also make use of it and add new logs or tags on the fly if you like. This may look something like this:
myFieldResolver(source, args, context, info) {
  const headers = {...};

  const parentSpan = info.span;
  // please use the same tracer you passed down to the extension
  const networkSpan = tracer.startSpan("NetworkRequest:" + endpoint, {
    childOf: parentSpan
  });

  // Let's transfer the span information to the headers
  tracer.inject(
    networkSpan,
    YourOpentracingImplementation.FORMAT_HTTP_HEADERS,
    headers
  );

  return doNetworkRequest(endpoint, headers).then(result => {
    networkSpan.finish()
    return result;
  }, err => {
    networkSpan.log({
      error: true,
      errorMessage: err
    });

    networkSpan.finish();
    return err;
  });
}
Selective Tracing
Sometimes you don't want to trace everything, so we provide ways to select if you want to start a span right now or not.
By Request
If you construct the extension with shouldTraceRequest you get the option to opt-in or out on a request basis.
When you don't start the span for the request the field resolvers will also not be used.
The function is called with the same arguments as the requestDidStart function extensions can provide, which is documented here.
When the request is not traced there will also be no traces of the field resolvers.
By Field
There might be certain field resolvers that are not worth the tracing, e.g. when they get a value out of an object and need no further tracing. To control if you want a field resolver to be traced you can pass the shouldTraceFieldResolver option to the constructor. The function is called with the same arguments as your field resolver and you can get the name of the field by info.fieldName. When you return false no traces will be made of this field resolvers and all underlying ones.
Modifying span metadata
If you'd like to add custom tags or logs to span you can construct the extension with onRequestResolve. The function is called with two arguments: span and infos onRequestResolve?: (span: Span, info: RequestStart)
Using your own request span
If you need to take control of initializing the request span (e.g because you need to use it during context initialization) you can do so by having creating it as context.requestSpan.
Options
-
server: Opentracing Tracer for the incoming request -
local: Opentracing Tracer for the local and outgoing requests -
onFieldResolve(source: any, args: { [argName: string]: any }, context: SpanContext, info: GraphQLResolveInfo): Allow users to add extra information to the span -
onFieldResolveFinish(error: Error | null, result: any, span: Span): Callback after a field was resolved -
shouldTraceRequest&shouldTraceFieldResolver: See Selective Tracing -
onRequestResolve(span: Span, info: GraphQLRequestContext): Add extra information to the request span -
createCustomSpanName(name: String, info: GraphQLResolveInfo): Allow users to provide customized span name -
onRequestError(rootSpan: Span, info: GraphQLRequestContextDidEncounterErrors): Callback when a request errors
Contributing
Please feel free to add issues with new ideas, bugs and anything that might come up. Let's make performance measurement to everyone <3
Contributors
Thanks goes to these wonderful people (emoji key):
This project follows the all-contributors specification. Contributions of any kind welcome!


